introduction
HQChart is the first project in China based on traditional PC stock client software (C++) ported to js/py platform, including K-line chart graphics library and Mai Grammar (Analyst Grammar) indicator executor.
Platform support: js, vue, uniapp, applet
Precautions
- Since HQChart is a financial plug-in, please don’t use the plug-in in illegal places.Please follow HQChart users use the protocol civilization to use the plugin.
- HQChart Commercial Use Instructions and User Agreement
- The built-in data source of HQChart is only for development and testing, please do not use it for any commercial purposes. At present, the built-in data source has canceled the cross-domain function. For local debugging, please refer to the tutorial to solve Chrome local debugging cross-domain, if it is VUE, please use 127.0.0.1:8080 Site debugging
Add new features
- Increase the maximum and minimum of a single indicator window
- Range selection supports dragging and moving
- Interval selection supports sub-areas
- Multi-day time-sharing chart supports page turning
- Add full color K line
- IncreaseFixed Range Volume Distribution Chart
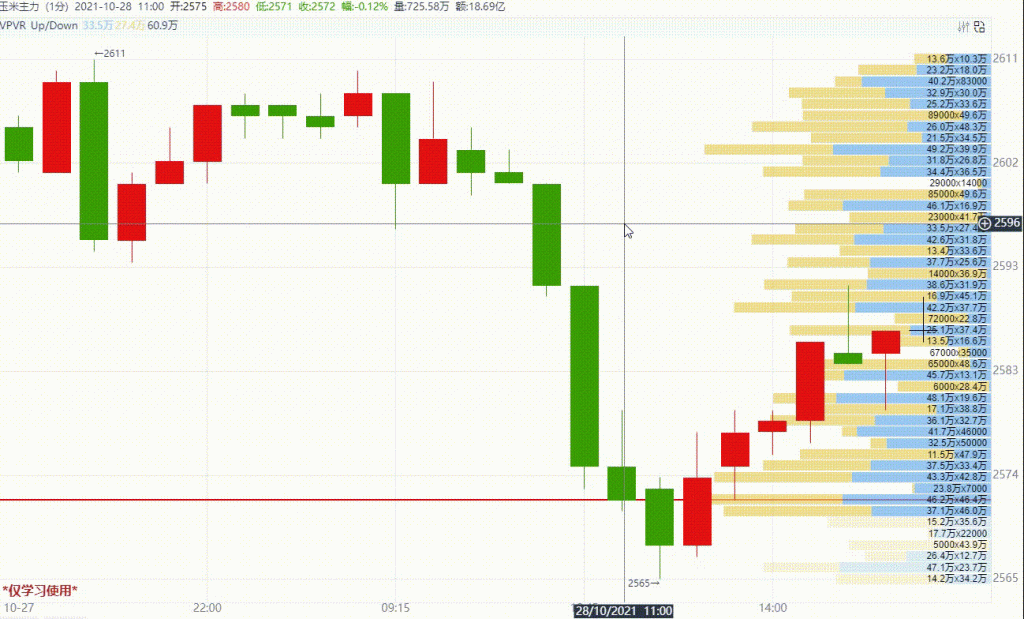
- IncreaseVisible range volume distribution chart
- Tongdaxin indicator engine supports single-step debugging mode
- New version of indicator window toolbar, direct canvas drawing
- Overlay stocks to increase the gain scale
- Y-axis custom scale supports setting dotted line points and line segment thickness settings
New function renderings
1. Visible range volume distribution chart

2.  Fixed range volume distribution

3. Full color K line

4. Maximize and minimize a single indicator window

5. Range selection supports dragging and moving

Changelog
- 11373 Landscape support indicator window title mode
- 11370 Tick indicator toolbar adds maximum and minimum buttons
- 11357 Interval selection sub-area supports drag and drop
- 11355 Added time-sharing chart page turning event
- 11344 K-line daily line increases the manual setting range selection range
- 11300 applet add color K line
For the update log, see:https://github.com/jones2000/HQChart/commits/master
Online demo address: https://opensource2.zealink.com/vuehqweb/hq.demo.page.html
Source address 1: https://gitee.com/jones2000/HQChart
Source address 2: https://github.com/jones2000/HQChart
uniapp plugin address::https://ext.dcloud.net.cn/plugin?id=4591
3rd party data connection example: https://github.com/jones2000/HQChart-Super
Personal blog: https://blog.csdn.net/jones2000
#HQChart #version #released #adding #volume #distribution #chart #indicator #window #maximum #minimum #News Fast Delivery
