STDF Viewer is a free and efficient graphical interface program for analyzing STDF reports of semiconductor testing.
By Noon Chen chennoon233@foxmail.com
| English |

Table of contents
Instructions
Open STDF file
The files that can be processed by STDF Viewer are the fourth set of standard STDF, and the STDF files compressed by ZIP*, GZ and BZIP can be opened directly without decompression.
There are three ways to open:
- After opening the software, click on the toolbar
打开Select the file. - Right-click the file and choose to open it with STDF Viewer (macOS does not support it temporarily due to pyinstaller).
- Drag files directly onto the program interface.
Notice: STDF files in ZIP format have limited support and need to meet the following conditions:
- without password
- A ZIP contains only one file
- The compression method of ZIP is
DEFLATEwhich is the mainstream compression method for each platform
Look for failure items
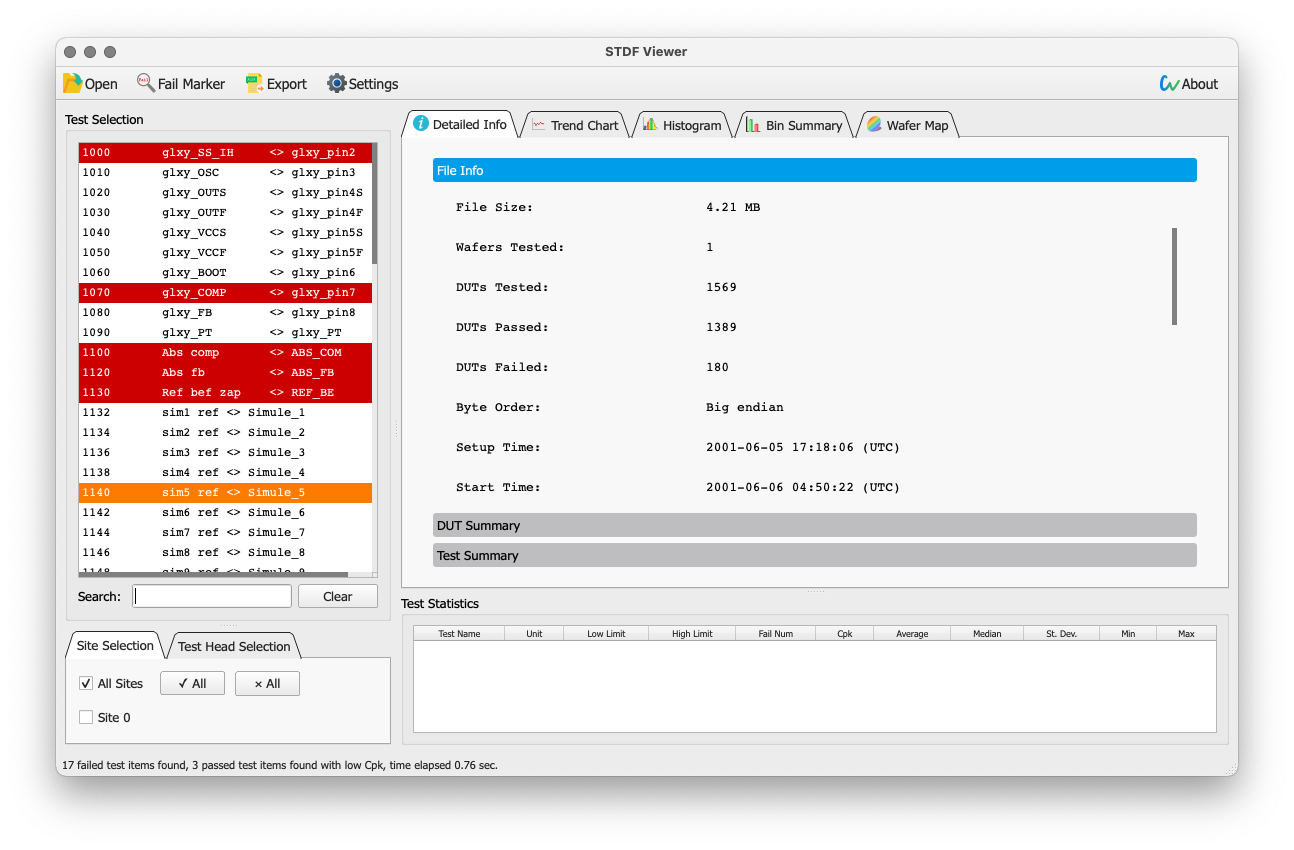
Click on the toolbar标记失效All existing failure test items can be marked asredif in设置turned on搜索低Cpk测项Cpk below the threshold (also available at设置set in ) will be marked asorange.
View DUT test information
DUT test information is located atSTDF信息 -> DUT详情.Each row in the table represents a DUT, and the failed DUT will be marked asred.
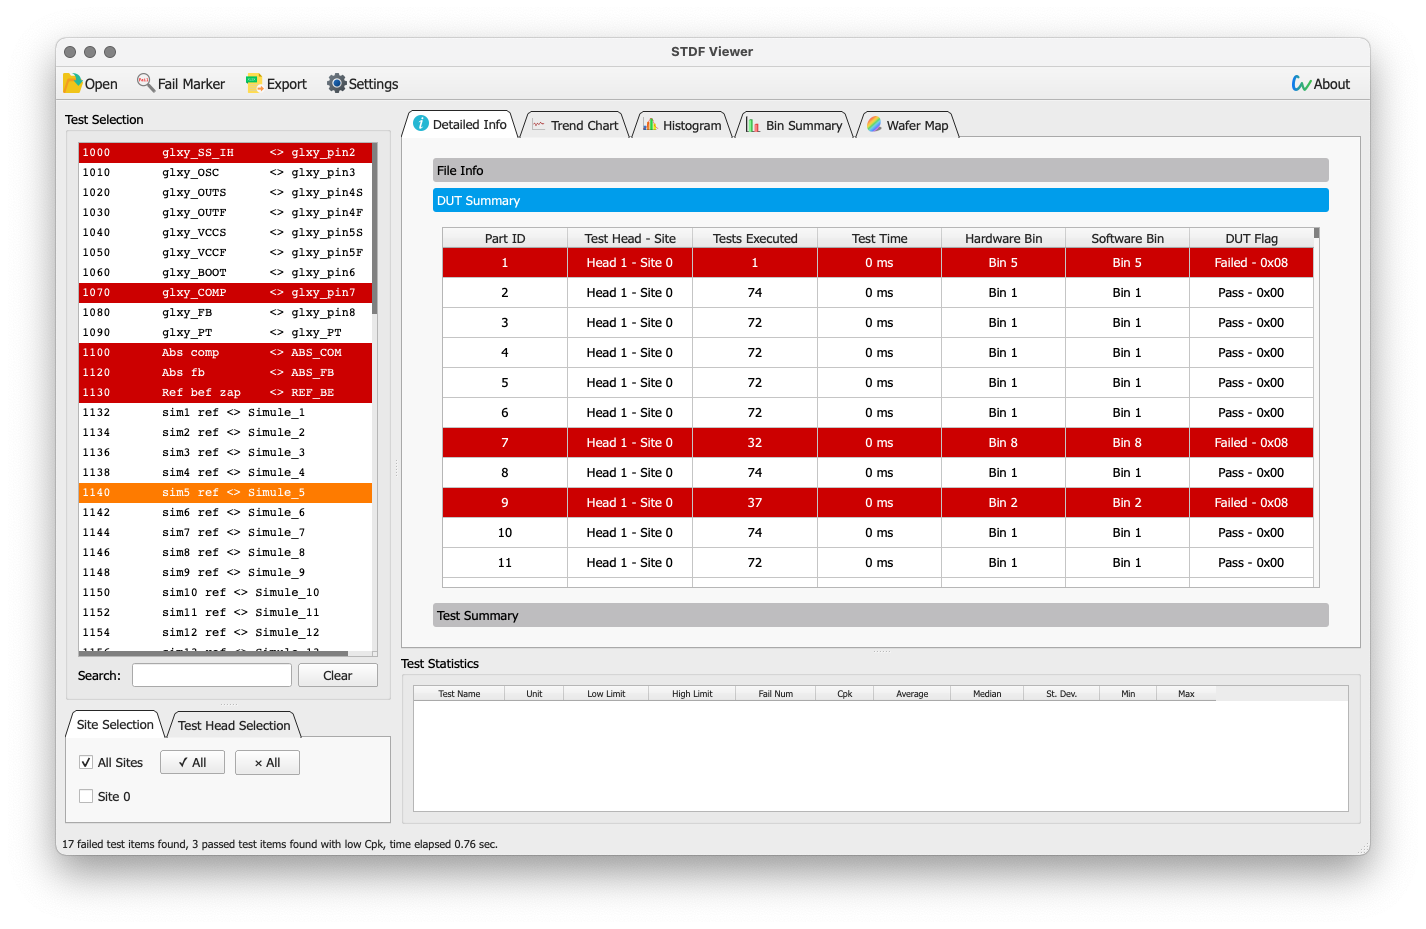
If STDF contains multi-head/site test data, the displayed DUT will be based on选择Site/Headto filter.
DUT information can be arranged according to each column, just click on the corresponding column.

Display GDR and DTR information
All GDR (Generic Data Record) and DTR (Datalog Text Record) data are listed inSTDF信息 -> GDR & DTR汇总middle. The exact positions of these two Records are not easy to determine, and the positions relative to PIR/PRR are given in the table.
GDR’s值Each row of represents a V1 data, according to{V1序列} {V1数据类型}: {V1数据}format to print.
Notice:BnandDnThe data in the format is expressed in hexadecimal

Analyze test data
hint: Functional test FTR has no test value, and the FTR test flag (Test Flag) is used for drawing in the trend chart and histogram
All items in the STDF file will be displayed in选择测项, you can choose more than one. A search box is provided below to filter.
Statistical information (Cpk, mean, variance, etc.) of the measurement item is displayed in the统计信息middle.
test raw data
After selecting the test item in theSTDF信息 -> 数据详情Check. Each row in the table represents a DUT, and each column represents a test item.

Trend
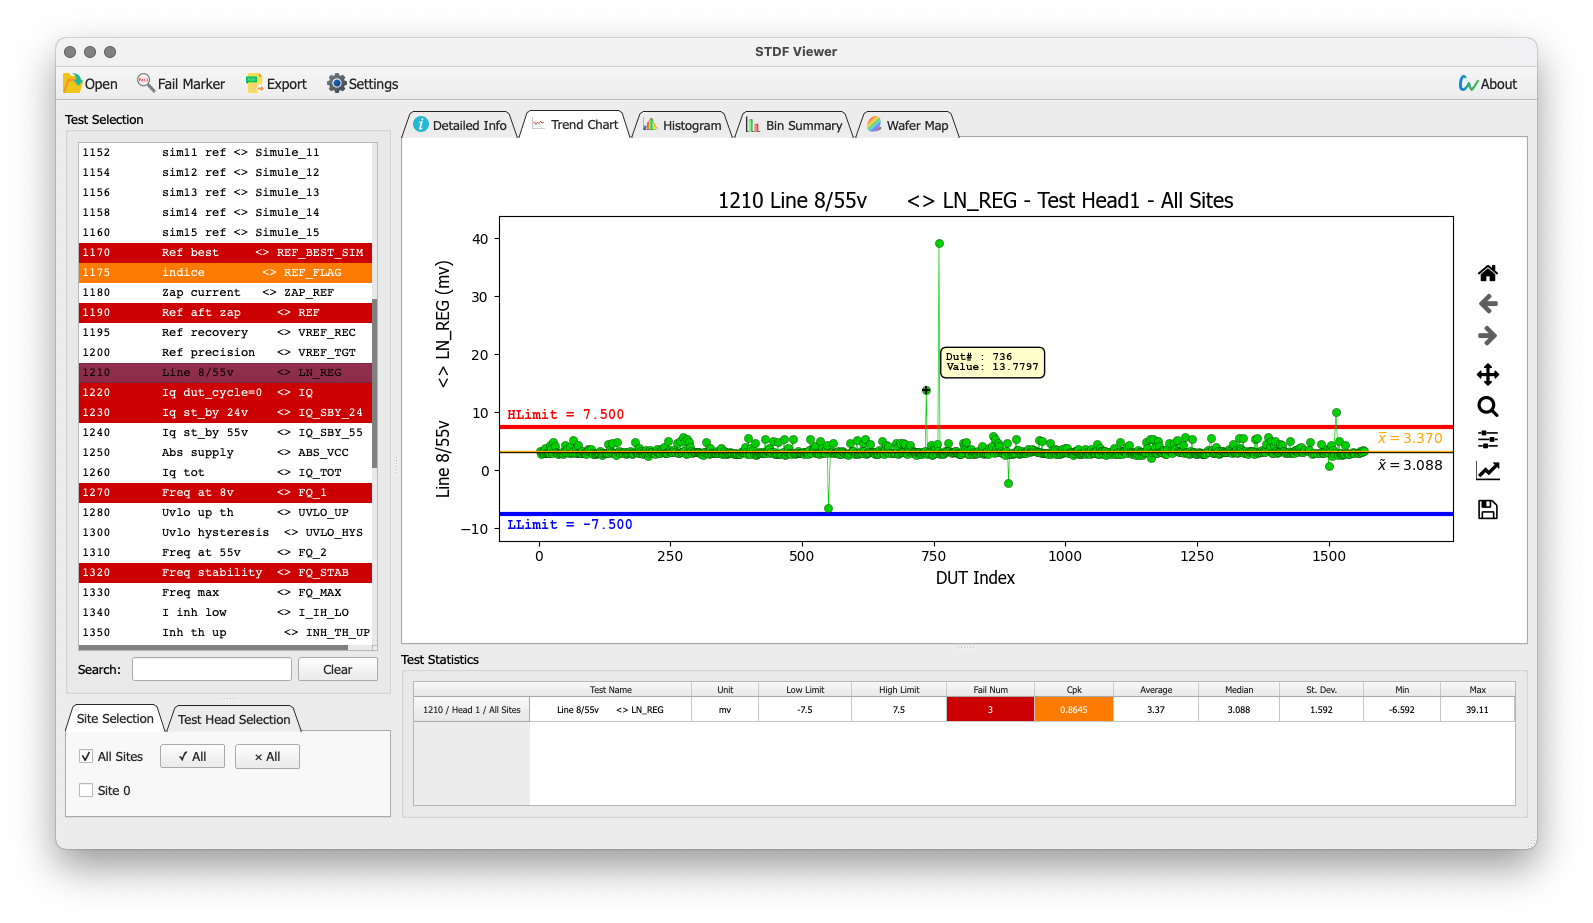
Display the trend graph of the test value changing with the DUT, the horizontal axis is the test value, and the horizontal axis is the serial number of all DUTs contained in the selected head/site. Hover over the data point with the mouse to view detailed data.
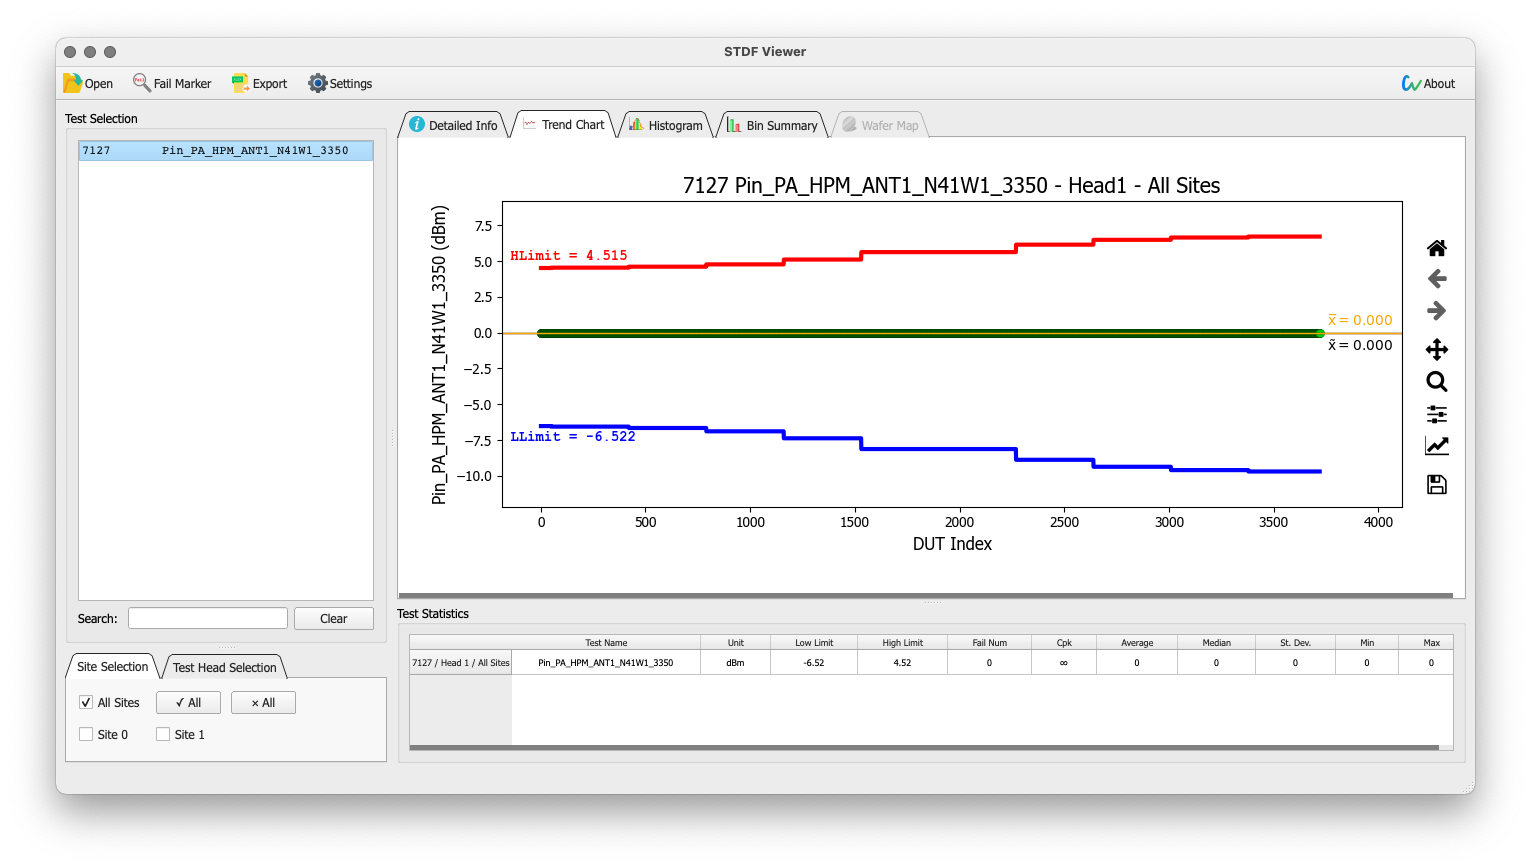
If PAT is turned on for the test item in STDF, the dynamic upper and lower limits will also be drawn.
histogram
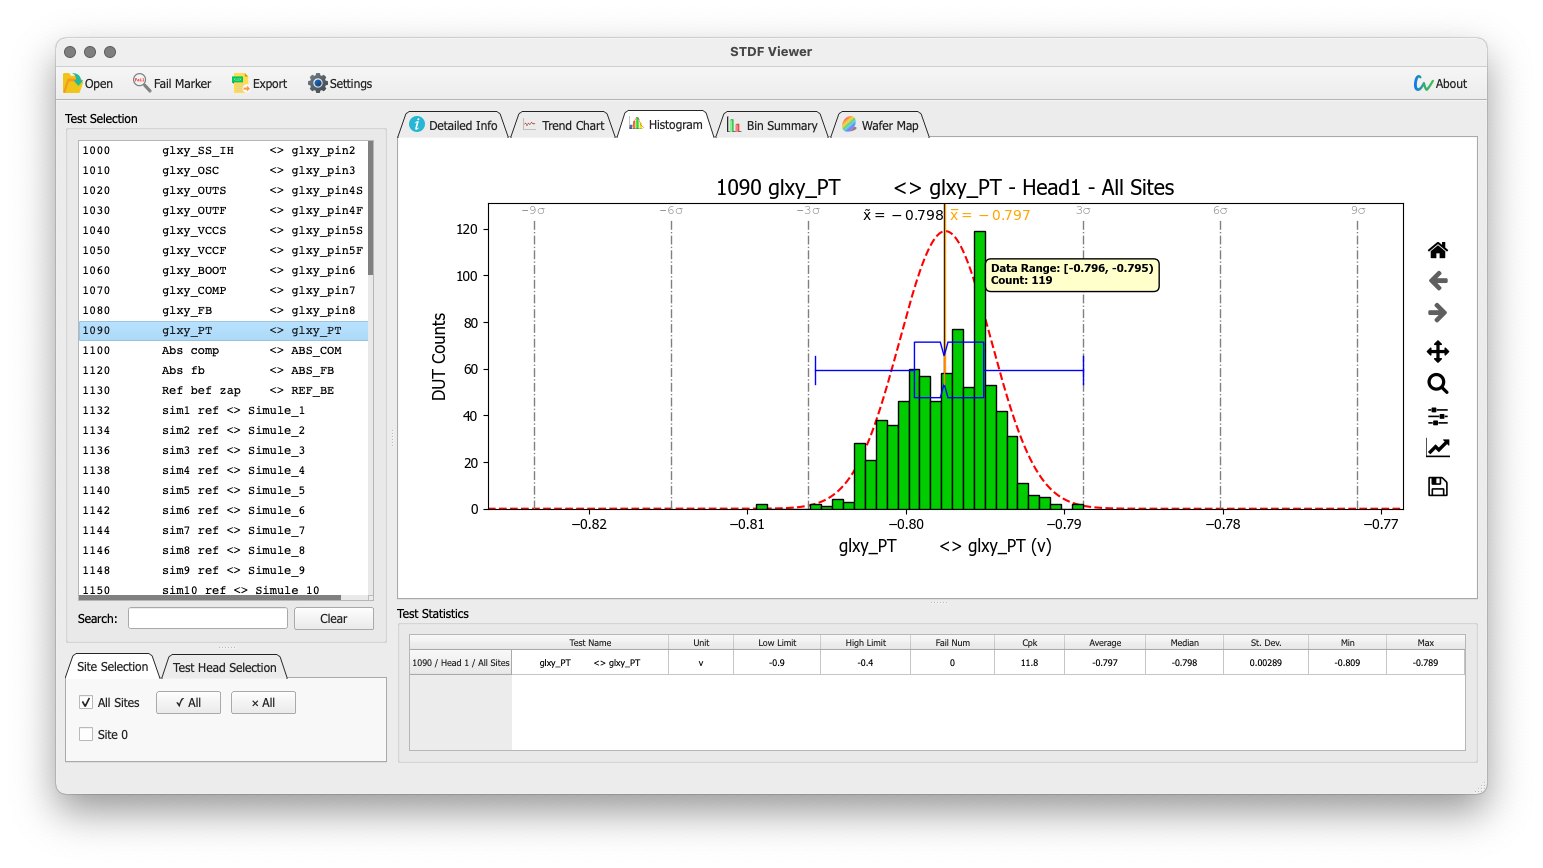
Display the data distribution of the test items, the horizontal axis is the test value, and the vertical axis is the number of DUTs in each interval. You can view the specific count by hovering the mouse over the interval.
Bin bucket distribution
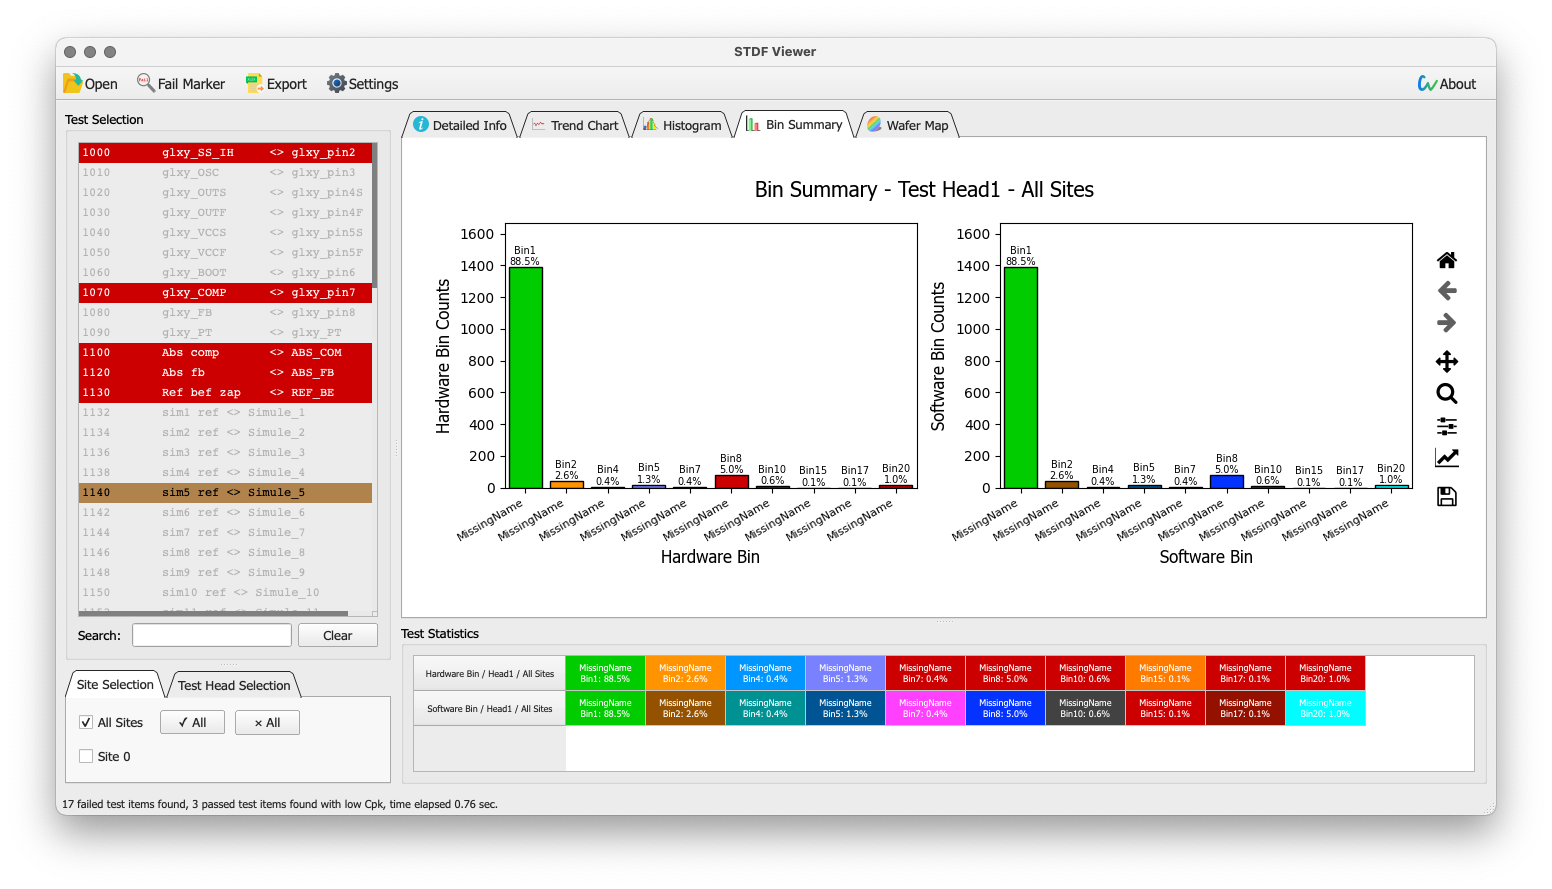
Displays the distribution of HBIN and SBIN buckets.
统计信息For each Bin number, name and percentage, empty Bins are automatically hidden.
View Wafer Map
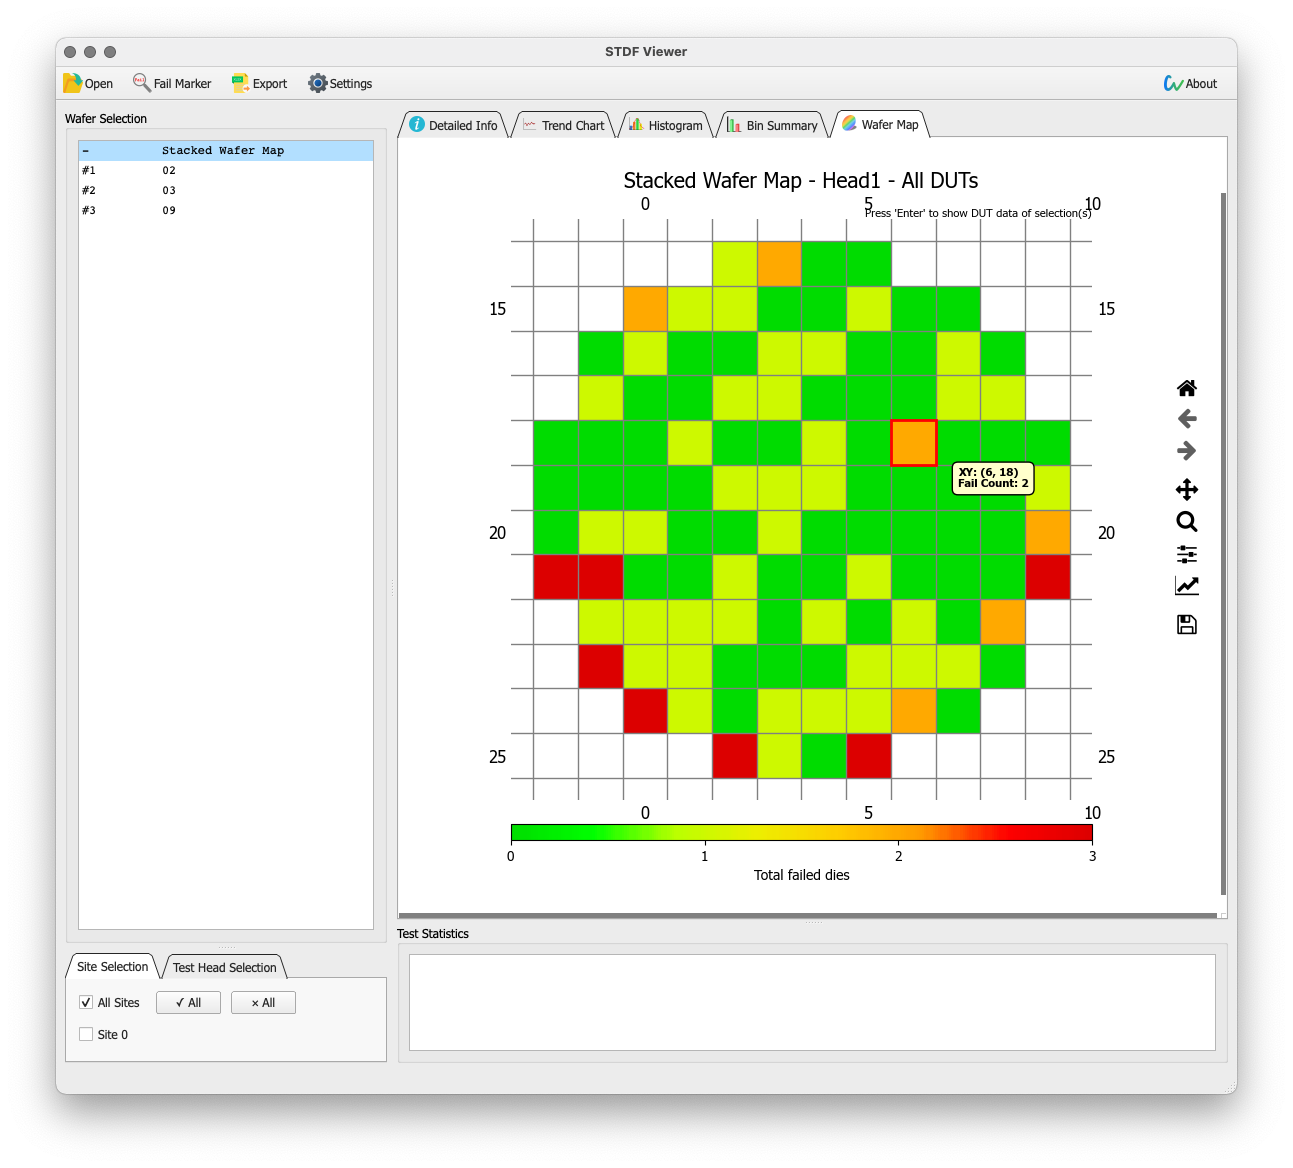
晶圆图It will only be enabled when there is wafer test information (WCR, WIR, WRR) in the STDF file.
选择晶圆the first line of the (Stacked Wafer Map) is the distribution map of the number of failures in the current file, and each (X, Y) coordinate number represents the number of failed DUTs.
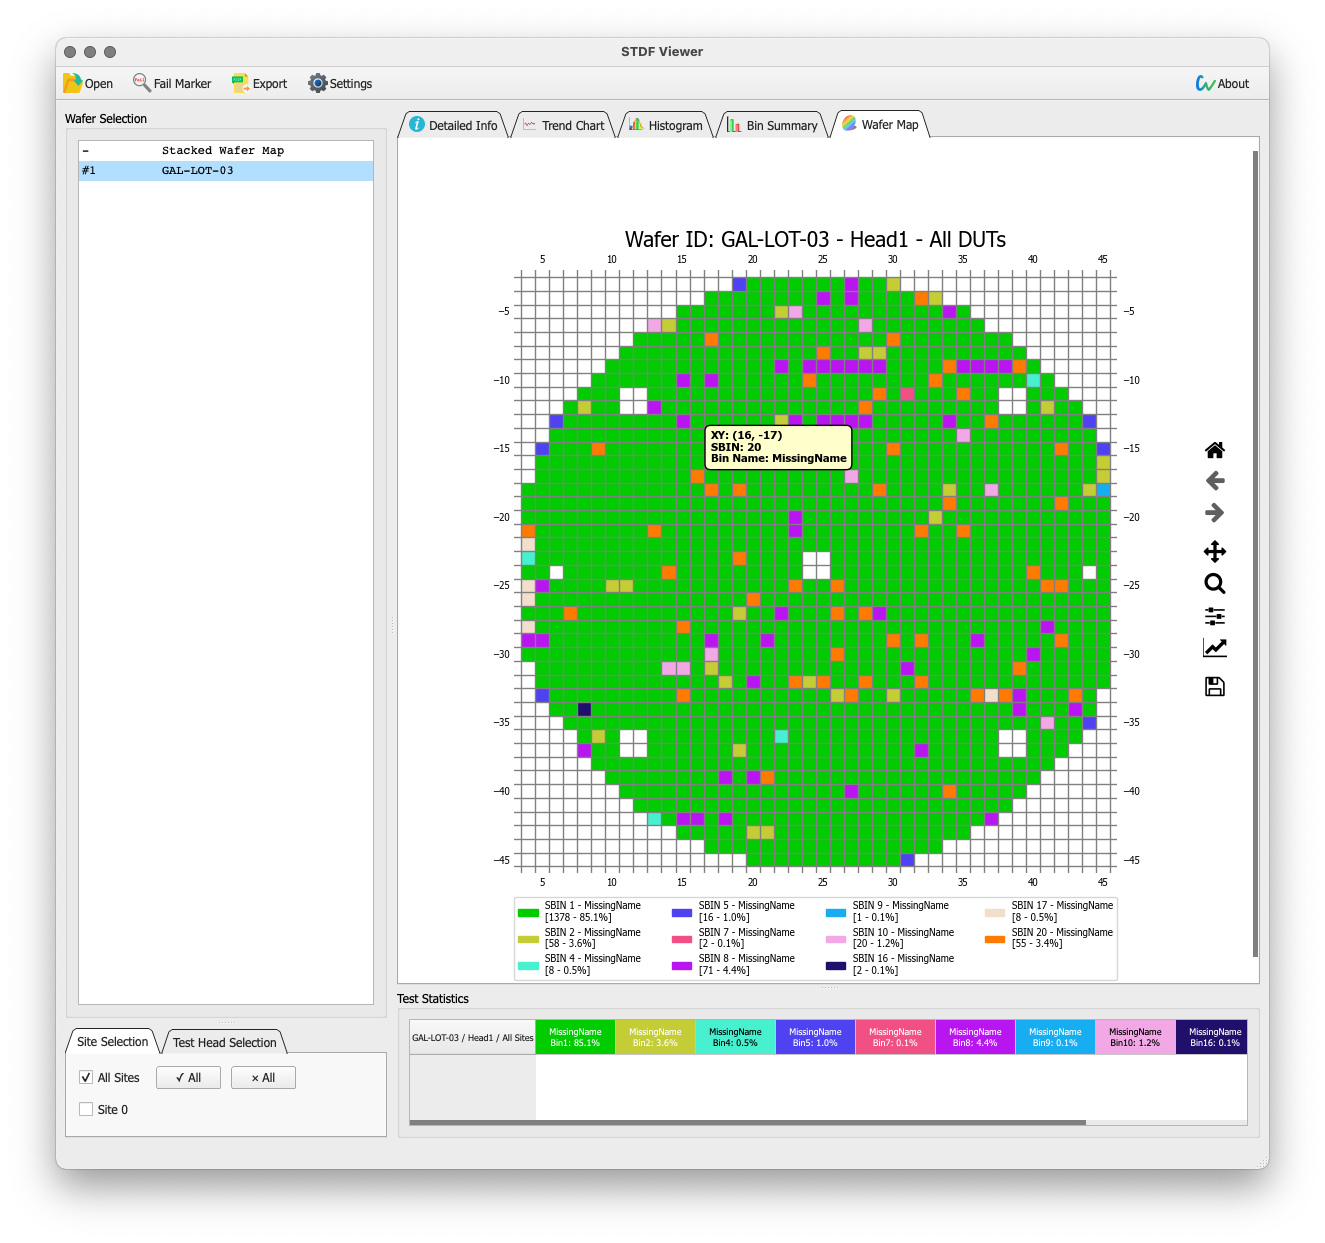
选择晶圆The other lines are the wafer data recorded in the file, and the color of each square is determined by SBIN, which can be customized in the settings.
Read all test data for a specific DUT
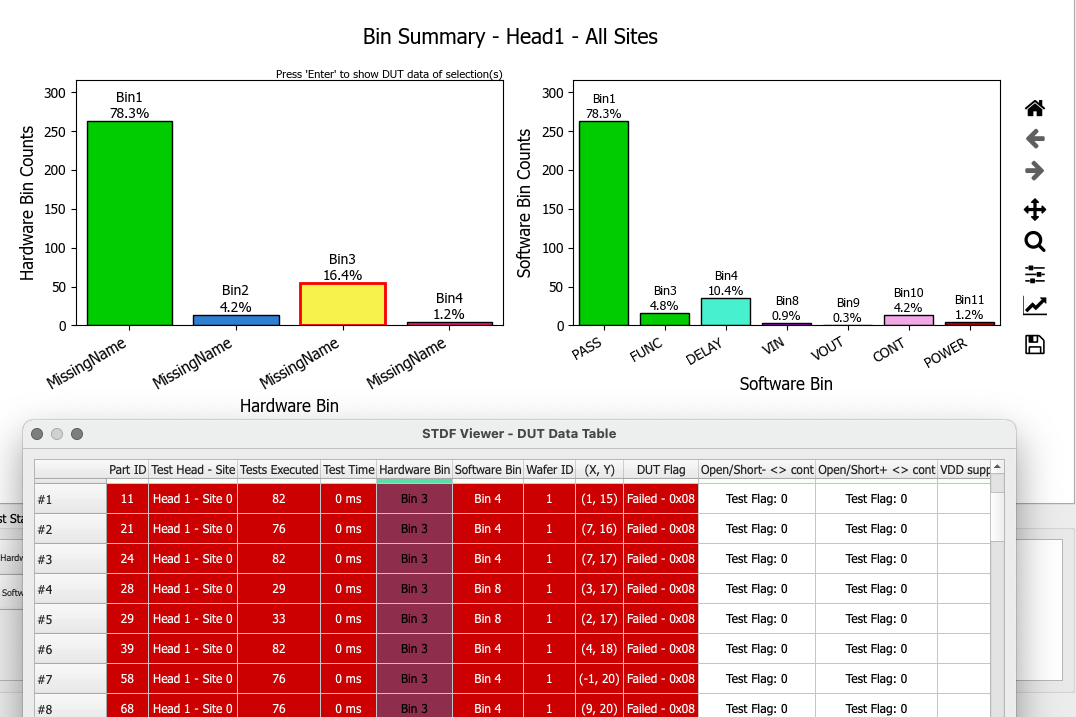
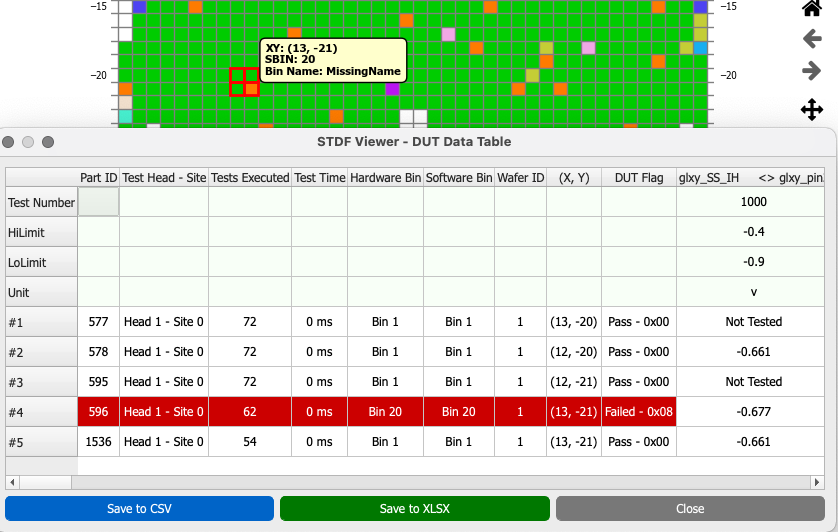
Sometimes you may need the values of all the test items of certain DUTs, as shown in the figure below, there are many ways to achieve this in STDF Viewer.
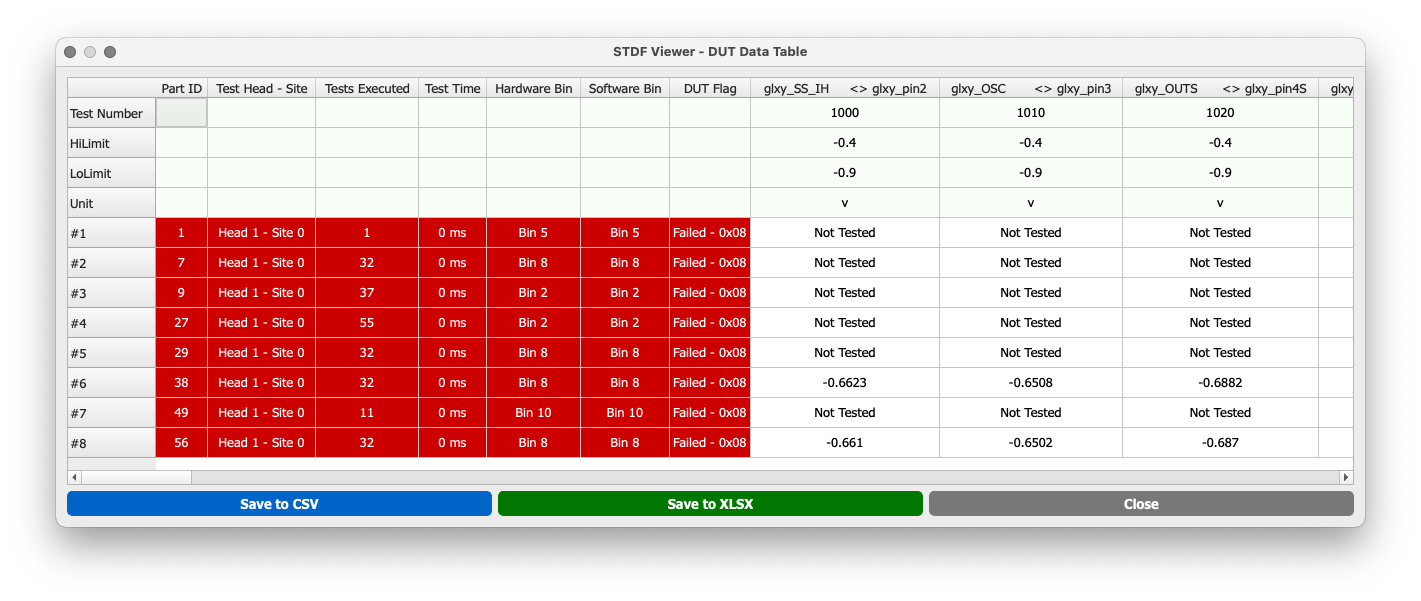
existDUT详情middle
After selecting the row, right click and select读取DUT详细数据.
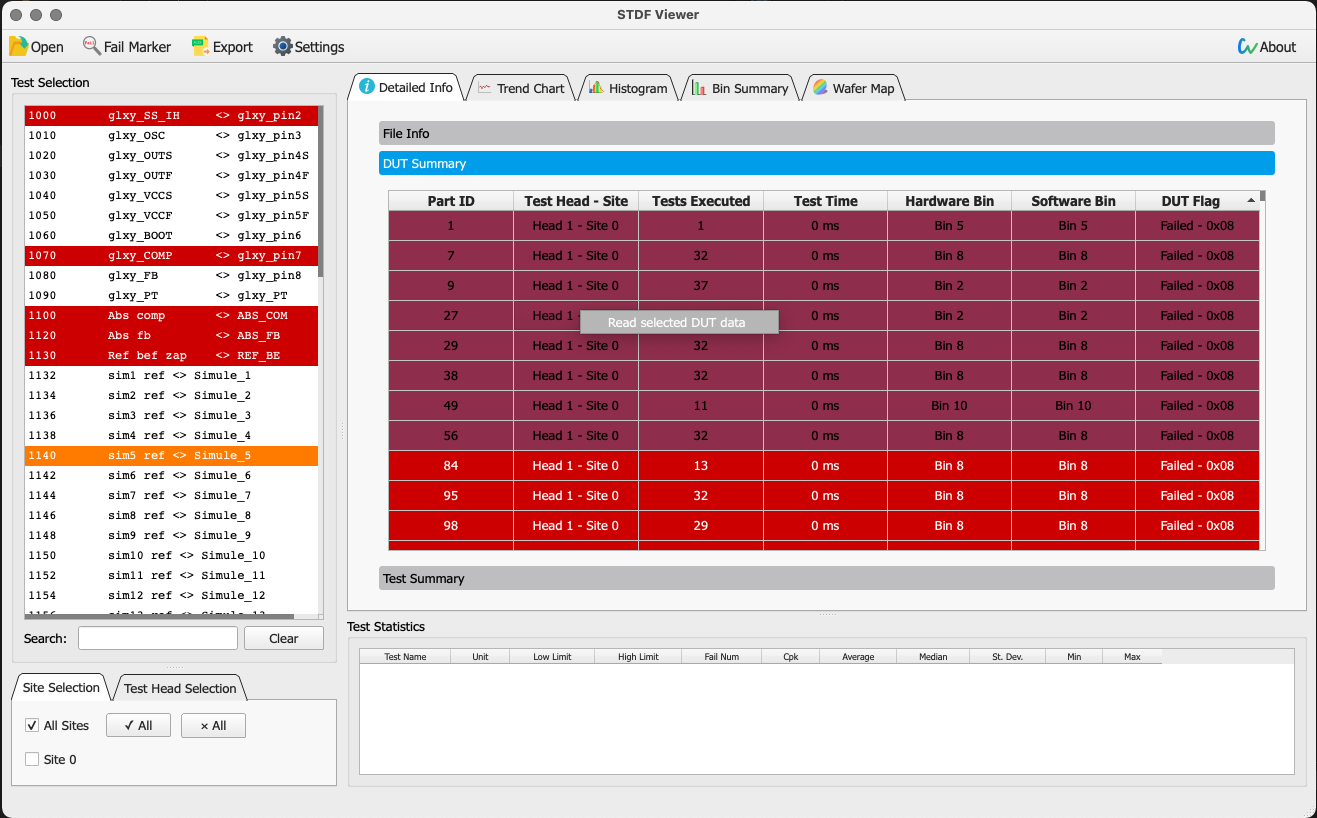
exist数据详情middle
After selecting a cell, right-click读取DUT详细数据.

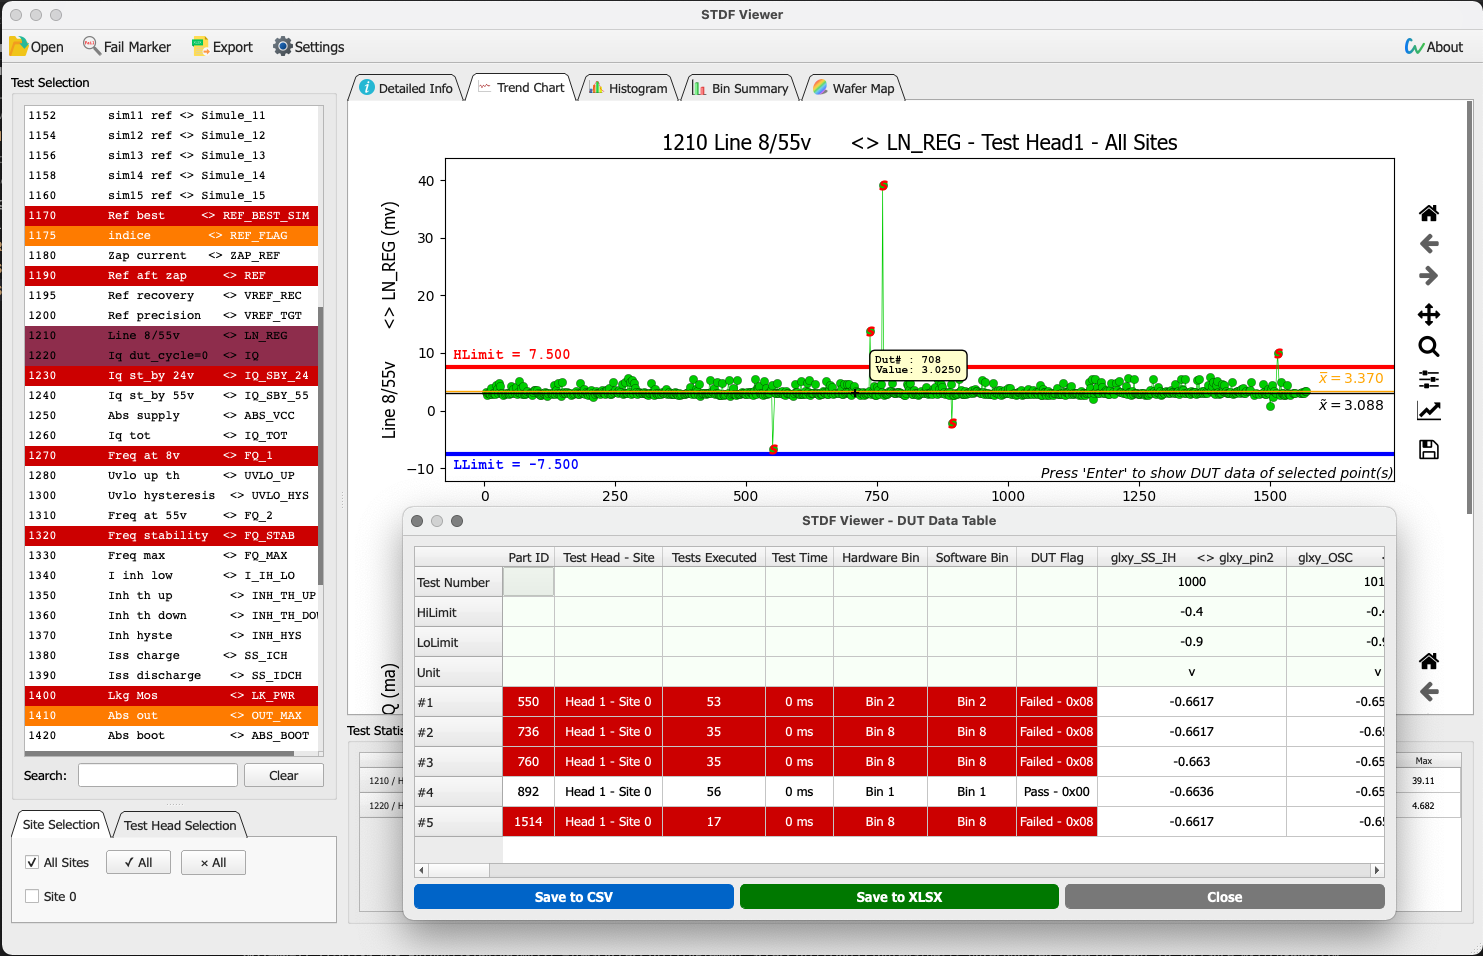
exist趋势图middle
Click on a data point in the graph to select it (or press and holdShiftfor multiple selections), the selected points will be marked with *S*,according toEnterThat’s it.
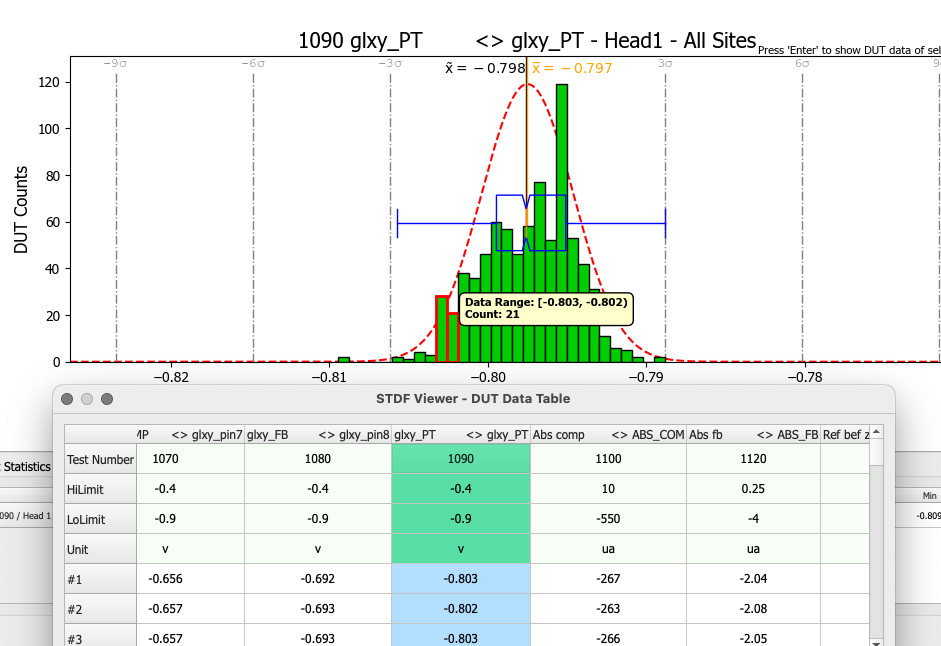
exist直方图middle
Click the long bar in the picture to select (or press and holdShiftfor multiple selections), the selected bar is displayed asred,according toEnterAll DUTs with test values within the selected range are then displayed.
existBin桶分布middle
Click the corresponding Bin graphic (press and holdShiftmultiple choice), pressEnterDisplay all DUTs in the selected Bin.
exist晶圆图middle
Click the square corresponding to the coordinates and pressEntercall out.
Generate Excel report
Basically, the content displayed by the program can be exported to the report.
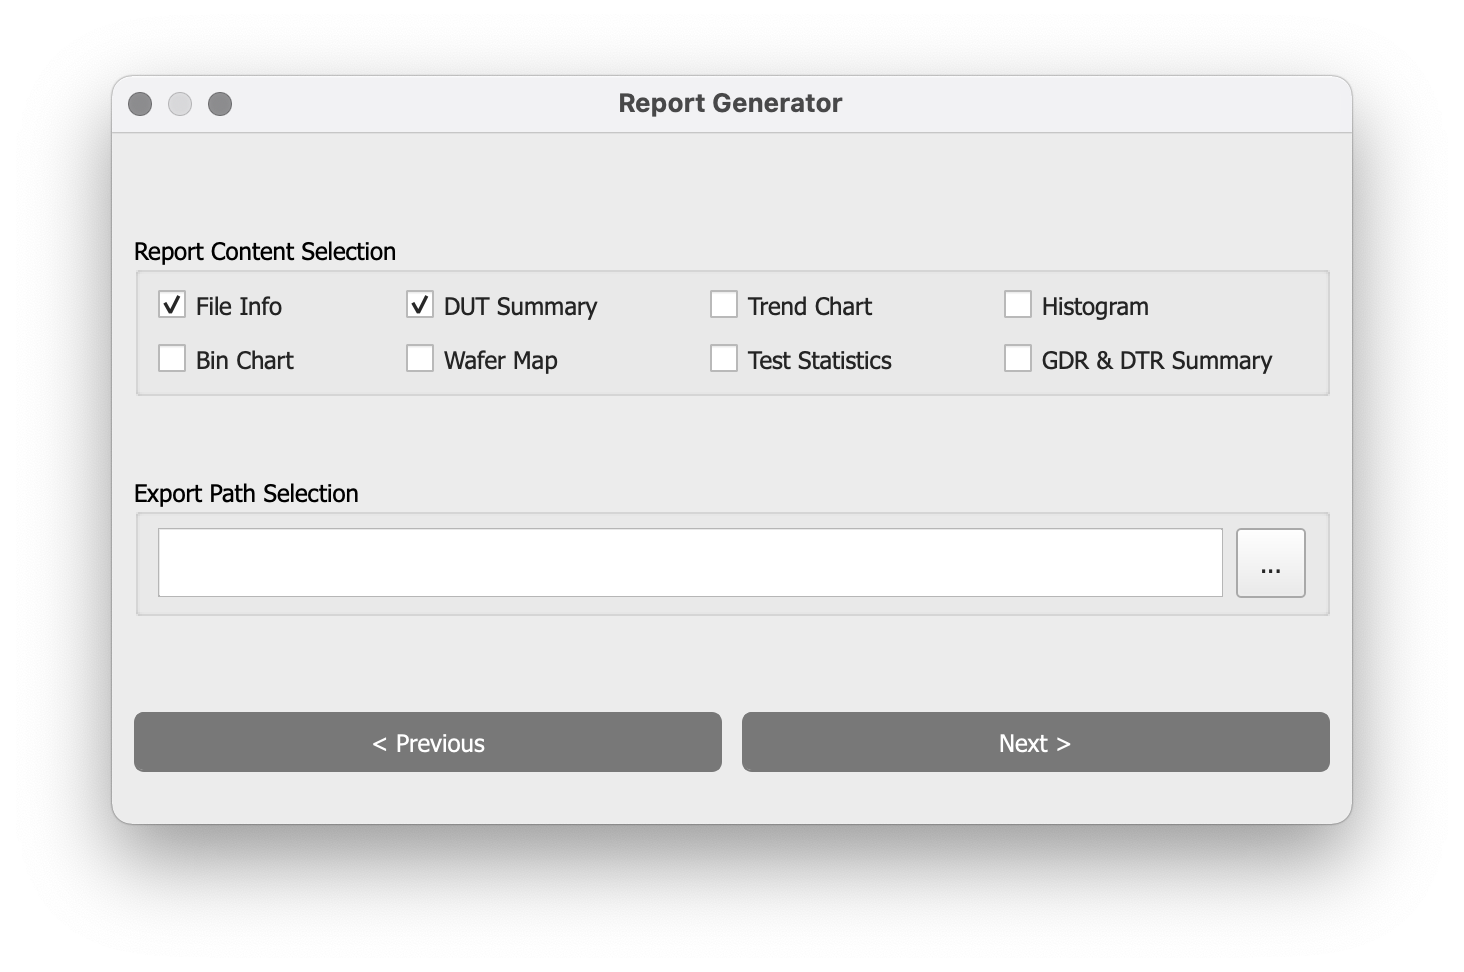
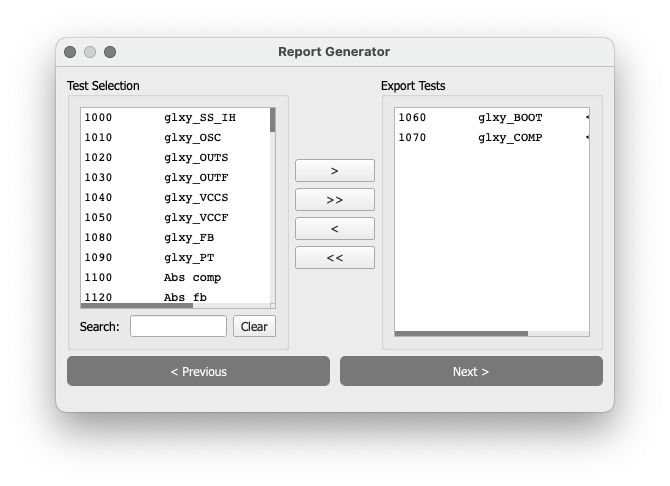
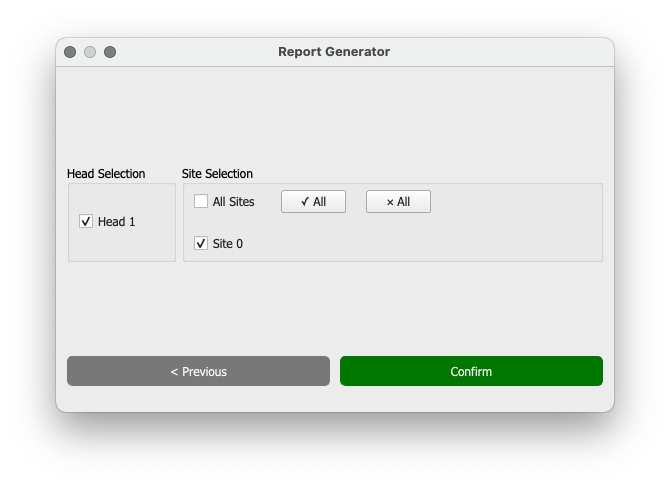
Report Content SelectionEach option corresponds to the sheet in Excel.
-
文件详情: File information, including MIR, MRR, ATR, RDR and SDR -
DUT详情: DUT information -
趋势图: trend graph + statistical information -
直方图: histogram + statistics -
Bin桶分布: Bin bucket distribution + Bin bucket statistics -
晶圆图: All wafer maps -
统计信息: Statistical information of the selected item -
GDR & DTR汇总: All GDR and DTR
The number of images/data reported depends on已选测项The content and head/site selection.
set up
STDF Viewer provides a global setting interface, which can be used to change the color of image elements, site/bin, etc. in the program interface or in the exported report, and you can try to modify it yourself.

change font
Users can customize the fonts in the interface and images.
First you need to rename the .ttf font file:
- Chinese font: add prefix
cn_ - English font: add prefix
en_
For example, a font file namedtestfontforchinese.ttfAs the default font for Chinese, you need to change the file name tocn_testfontforchinese.ttffonts in other languages are not affected.
Copy the renamed file to/fontsfolder, the location is as follows:
- Windows: next to the program
- macOS:
STDF Viewer.app/Contents/Resources/fonts - Ubuntu:
/usr/local/bin/STDF-Viewer/fonts
It takes effect after restarting the software.

Encounter problems?
If you encounter problems during use, follow the steps below:
- After opening STDF-Viewer, click on the upper right corner
关于.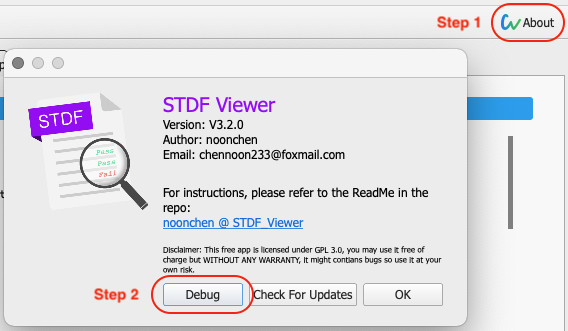
- click
调试button to open the debug interface.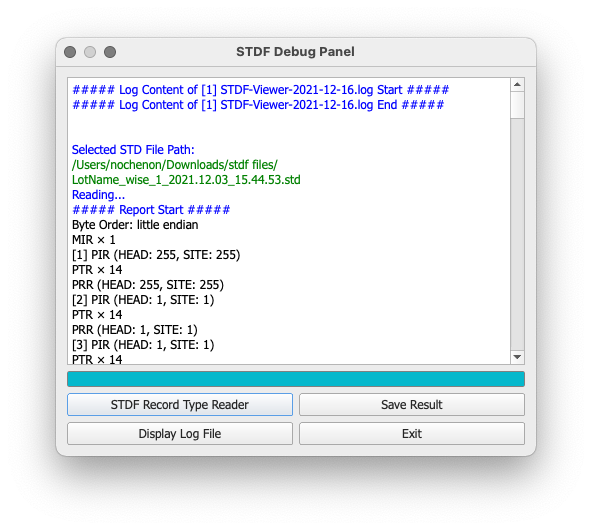
- click
显示Log内容Print out the history report; if the error is file related, click分析文件Record类型Then select the file with the error. - click
保存结果Save the result and create an issue on GitHub.
thank you
STDF Viewer uses the code of the following open source projects, thanks to the authors:
3.0.5 and newer versions no longer use:
software license
STDF Viewer adopts GPL V3.0, and the program is completely free. The author is not responsible for any problems caused by using this software. Users are also requested to use this software with a skeptical attitude.
The icons I designed for STDF Viewer are licensed under Attribution-NonCommercial 4.0 (CC BY-NC 4.0).
download
Click here
Cooperation
All kinds of PR and Issue are welcome~
#free #GUI #tool #visualize #STDF #semiconductor #Standard #Test #Data #Format #data #files