Author: vivo Internet Server Team – Chen Dongxing, Li Haoxuan, Chen Jinxia
With the increasing complexity of business, performance optimization has become a required course for every technician. Where to start with performance optimization? How to locate the performance bottleneck from the symptom of the problem? How to verify that optimization measures are effective? This article will introduce and share the performance tuning practices in vivo push recommended projects, hoping to provide you with some lessons and references.
1. Background introduction
In Push recommendation, the online service receives events from Kafka that need to reach users, and then selects the most suitable articles for these target users to push. The service is developed in Java and is CPU-intensive.
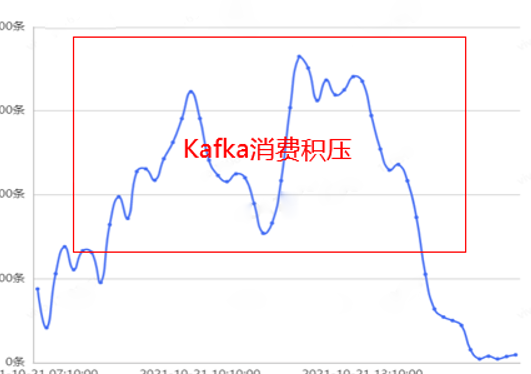
With the continuous development of the business, the concurrency of requests and the amount of model calculation are increasing, resulting in performance bottlenecks in engineering, serious backlog of Kafka consumption, unable to complete the distribution of target users in time, and unsatisfied business growth demands. Therefore, special performance optimization is urgently needed.
2. Optimizing metrics and ideas
Our performance measure is throughput TPS, which is given by the classical formula TPS = Concurrency / Average Response Time RT It can be known that if you need to increase TPS, there are two ways:
Increase the number of concurrentsuch as increasing the number of parallel threads of a single machine, or horizontally expanding the number of machines;
Lower average response time RTincluding the execution time of the application thread (business logic) and the GC time of the JVM itself.
In practice, the CPU utilization of our machines is already very high, reaching more than 80%, and the expected benefit of increasing the number of concurrency of a single machine is limited, so the main energy is devoted to reducing RT.
The following will hot code and JVM GC Two aspects are explained in detail, how do we analyze and locate the performance bottleneck, and use 3 tricks to increase the throughput by 100%.
Three, hot code optimization articles
How to quickly find the most time-consuming hot code in the application? With Alibaba’s open source arthas tool, we obtained the CPU flame graph of the online service.
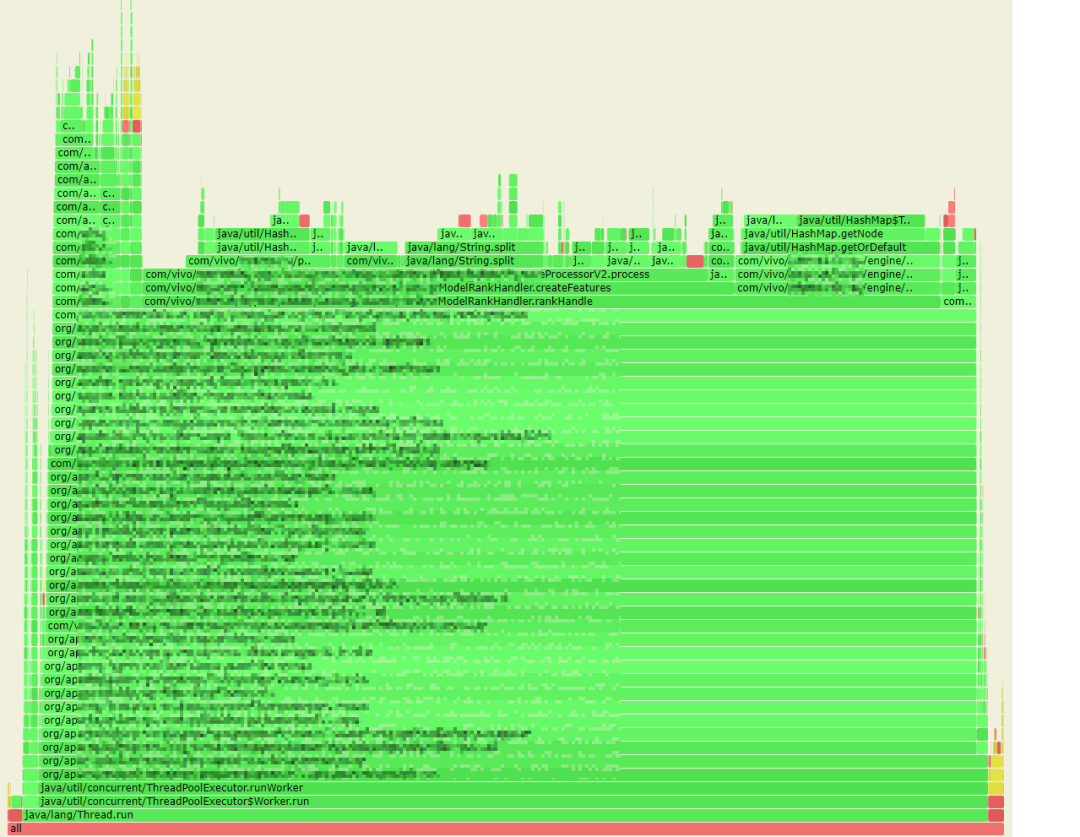
Description of flame graph: The flame graph is an SVG image generated based on the perf result, which is used to display the call stack of the CPU.
The y-axis represents the call stack, with each layer being a function. The deeper the call stack, the higher the flame, with the executing function at the top and its parent function below.
The x-axis represents the number of samples. If a function occupies a wider width on the x-axis, it means that it has been sampled more times, that is, the execution time is long. Note that the x-axis does not represent time, but all call stacks combined, in alphabetical order.
The flame graph is to see which function at the top level occupies the largest width. As long as there is a “plateaus”, the function may have performance issues.
The color has no special meaning, because the flame graph represents the busyness of the CPU, so generally choose a warm color.
3.1 Optimization 1: Try to avoid the native String.split method
3.1.1 Performance Bottleneck Analysis
From the flame graph, we first found that 13% of the CPU time was spent on the java.lang.String.split method.
Students who are familiar with performance optimization will know that the native split method is a performance killer with low efficiency, and it will consume a lot of resources when it is called frequently.
However, it is necessary to frequently split when processing features in business. How to optimize it?
By analyzing the split source code and the usage scenarios of the project, we found 3 optimization points:
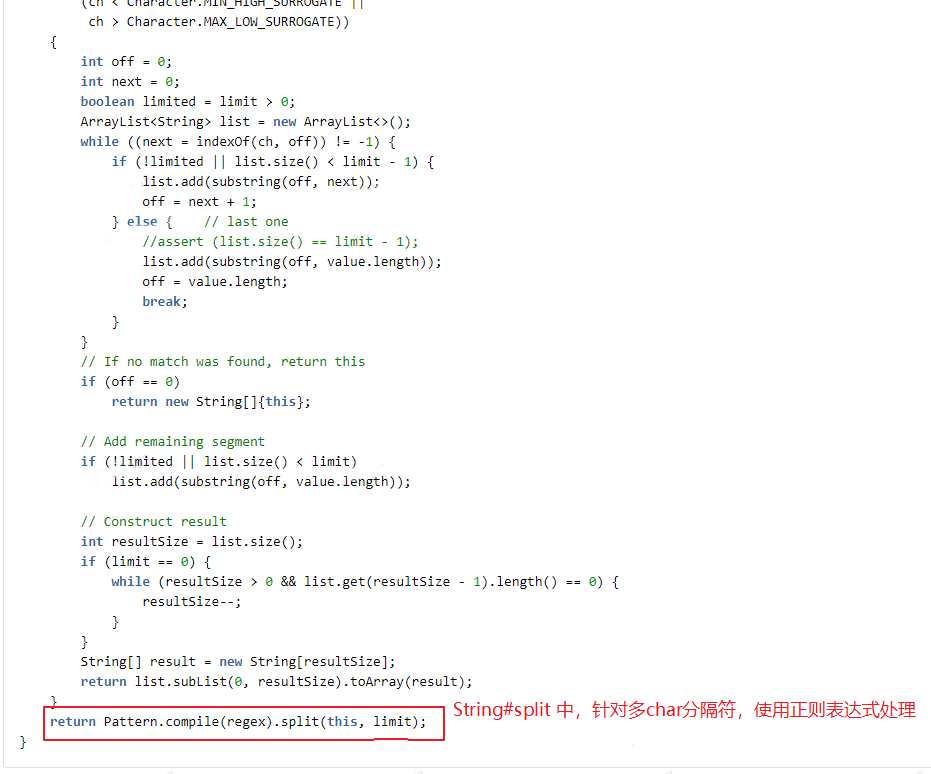
(1) Regular expressions are not used in the business, and when the native split processes the delimiter of 2 or more characters, it is processed by regular expressions by default; as we all know,Efficiency of regular expressionsis lowof.
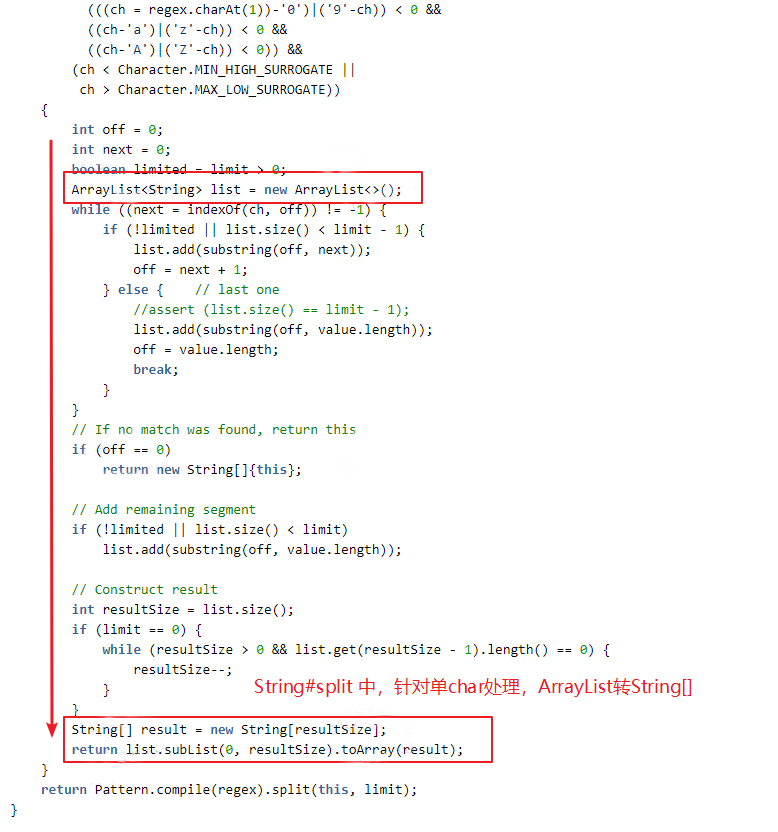
(2) When the delimiter is a single character (and not a regular expression character), the native String.split performs performance optimization processing, but some internal conversion processing in the middle is redundant and consuming in our actual business scenario. performance.
ThatImplementationYes: implement the segmentation process through String.indexOf and String.substring methods, store the segmentation result in the ArrayList, and finally convert the ArrayList to string[] output. In our business, in fact, we often need list-type results, and there are two more lists and strings.[] mutual rotation.
(3) In the business where split is called most frequently, in fact, only the first result after split is needed; the native split method or other tools have overloaded optimization methods, you can specify the limit parameter, and you can return in advance after the limit number is met; but In business code, use str.split(delim)[0] way, non-performing best.
3.1.2 Optimization scheme
For business scenarios, we have customized a performance-optimized split implementation.
import java.util.ArrayList;import java.util.List;import org.apache.commons.lang3.StringUtils;public class SplitUtils {public static String splitFirst(final String str, final String delim) {if (null == str || StringUtils.isEmpty(delim)) {return str;}int index = str.indexOf(delim);if (index < 0) {return str;}if (index == 0) {return "";}return str.substring(0, index);}public static List<String> split(String str, final String delim) {if (null == str) {return new ArrayList<>(0);}if (StringUtils.isEmpty(delim)) {List<String> result = new ArrayList<>(1);result.add(str);return result;}final List<String> stringList = new ArrayList<>();while (true) {int index = str.indexOf(delim);if (index < 0) {stringList.add(str);break;}stringList.add(str.substring(0, index));str = str.substring(index + delim.length());}return stringList;}}
Compared with the native String.split, there are several changes:
Abandon regular expression support, only support split by delimiter;
Returns a list directly as a parameter. The implementation of segmentation processing is similar to the processing of single characters in the native implementation. Using the string.indexOf and string.substring methods, the segmentation results are put into the list, and the parameters are returned directly to the list, reducing data conversion processing;
Provides the splitFirst method, which further improves performance when the business scenario only needs the first string before the separator.
3.1.3 Microbenchmarks
How to verify our optimization effect?First select jmh asmicrobenchmark toolcompared with the native String.split and apache’s StringUtils.split method, the test results are as follows:
Use single character as delimiter
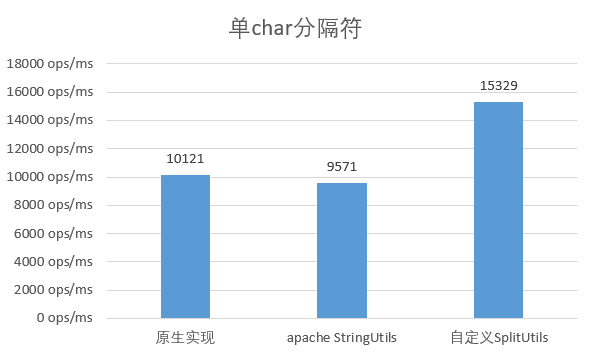
It can be seen that the performance of the native implementation is similar to that of the apache tool class, while the performance of the custom implementation is improved by about 50%.
Use multiple characters as delimiters
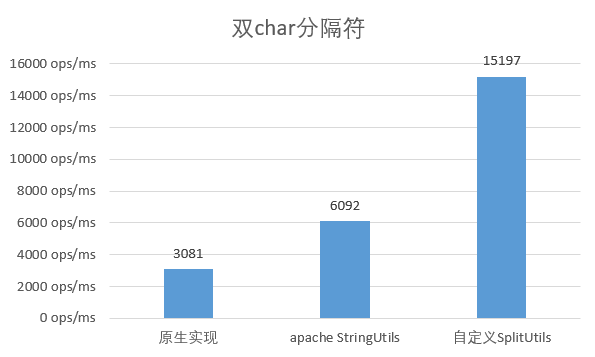
When the separator uses 2 characters, the performance of the original implementation is greatly reduced, only 1/3 of the single char; and the apache implementation is also reduced to 2/3 of the original, and the custom implementation is basically the same as the original.
Use a single character as the separator, just return the first split result
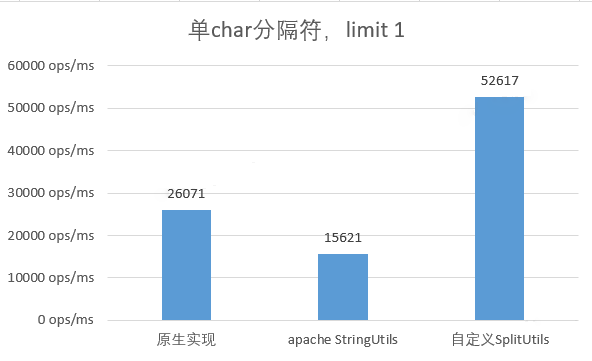
When a single character is used as the delimiter and only the first split result is required, the performance of the custom implementation is 2 times that of the native implementation, and 5 times that of taking the complete result of the native implementation.
3.1.4 End-to-end optimization effect
After verifying the benefits through micro-benchmark testing, we will optimize the deployment to online services to verify the overall end-to-end performance benefits;
Reuse arthas to collect flame graphs, and the time-consuming of the split method is reduced to 2% left and right; end-to-end overall time-consumingdown 31.77% throughputup 45.24% the performance gains are particularly pronounced.
3.2 Optimization 2: Speed up the table lookup efficiency of map
3.2.1 Performance Bottleneck Analysis
From the flame graph, we found that the HashMap.getOrDefault method also takes a lot of time, reaching 20%, mainly on the query weight map, because:
In the business, high-frequency calls are indeed required, and the number of features expands after feature cross processing, and the call concurrency of a single machine reaches about 1000w ops/s.
The weight map itself is also very large, storing more than 10 million entries, occupying a large amount of memory; at the same time, the probability of hash collision also increases, and the query efficiency during collision is reduced from O(1) to O(n) (linked list). ) or O(logn) (red-black tree).
Hashmap itself is a very efficient map implementation. At first, we tried to adjust the load factor loadFactor or switch to other map implementations, but did not achieve significant benefits.
How can we improve the performance of the get method?
3.2.2 Optimization scheme
During the analysis, we found that the key of the query map (the feature key after cross processing) is a string type, and the average length is more than 20; we know that the equals method of string is actually traversing and comparing char[] The characters in , the longer the key, the lower the comparison efficiency.
public boolean equals(Object anObject) {if (this == anObject) {return true;}if (anObject instanceof String) {String anotherString = (String)anObject;int n = value.length;if (n == anotherString.value.length) {char v1[] = value;char v2[] = anotherString.value;int i = 0;while (n-- != 0) {if (v1[i] != v2[i])return false;i++;}return true;}}return false;}
Is it possible to shorten the length of the key, or even change it to a numeric type? With a simple microbenchmark, we found that the idea should work.
So I communicated with the algorithm classmates. Coincidentally, the algorithm classmates happened to have the same demands. During the process of switching to the new training framework, they found that the efficiency of string was particularly low, and the features needed to be replaced by numerical values.
It hit it off, and the plan was quickly determined:
The algorithm students map the feature key to a long value, and the mapping method is a custom hash implementation to minimize the hash collision probability;
The algorithm classmates train and output the weight map of the new model, which can retain more entries to level the performance indicators of the baseline model;
After leveling the performance indicators of the baseline model, the new grayscale model on the online server,The key of the weight map is changed to the long typeto verify performance metrics.
3.2.3 Optimization effect
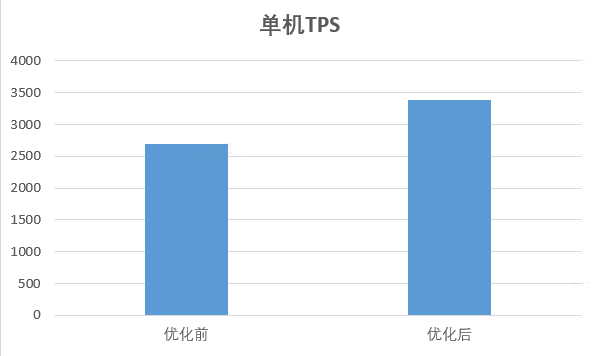
With a 30% increase in the number of feature entries (the model effect exceeds the baseline), the engineering performance has also achieved significant gains;
Overall time-consuming end-to-enddown 20.67%throughputup 26.09%; In addition, good gains have been made in memory usage, and the memory size of the weight mapdown 30%.
Fourth, JVM GC optimization articles
Java is designed with automatic garbage collection to free application developers from manual dynamic memory management. Developers do not need to care about memory allocation and reclamation, nor the lifetime of allocated dynamic memory. This completely eliminates some memory management related bugs at the cost of adding some runtime overhead.
When developing on small systems, the performance overhead of GC is negligible, but when scaled to large systems (especially those applications with large amounts of data, many threads, and high transaction rates), the overhead of GC is non-negligible and may even become significant performance bottleneck.
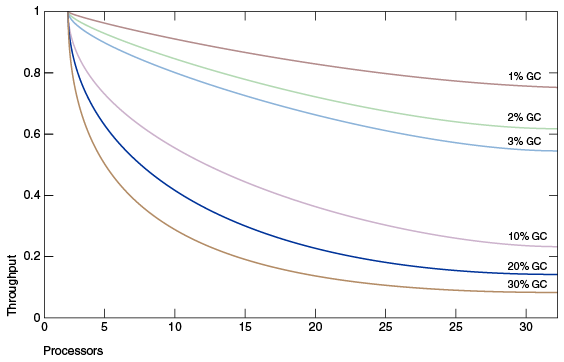
The diagram above simulates an ideal system that is fully scalable except for garbage collection. The red line represents an application that spends only 1% of its time in garbage collection on a uniprocessor system. This means a throughput penalty of over 20% on a system with 32 processors. The magenta line shows that for an application with 10% garbage collection time (in a uniprocessor application, the garbage collection time is not too long), when scaling to 32 processors, more than 75% of the throughput is lost .
Therefore JVM GC is also an important performance optimization measure.
Our recommended service uses high-profile computing resources (64 cores and 256G), and the influencing factors of GC are considerable. By collecting and monitoring online service GC data, it is found that our service GC situation is quite bad, and the cumulative YGC time per minute is about 10s.
Why is the GC overhead so large, and how to reduce the GC time?
4.1 Optimization 3: Use off-heap cache instead of on-heap cache
4.1.1 Performance Bottleneck Analysis
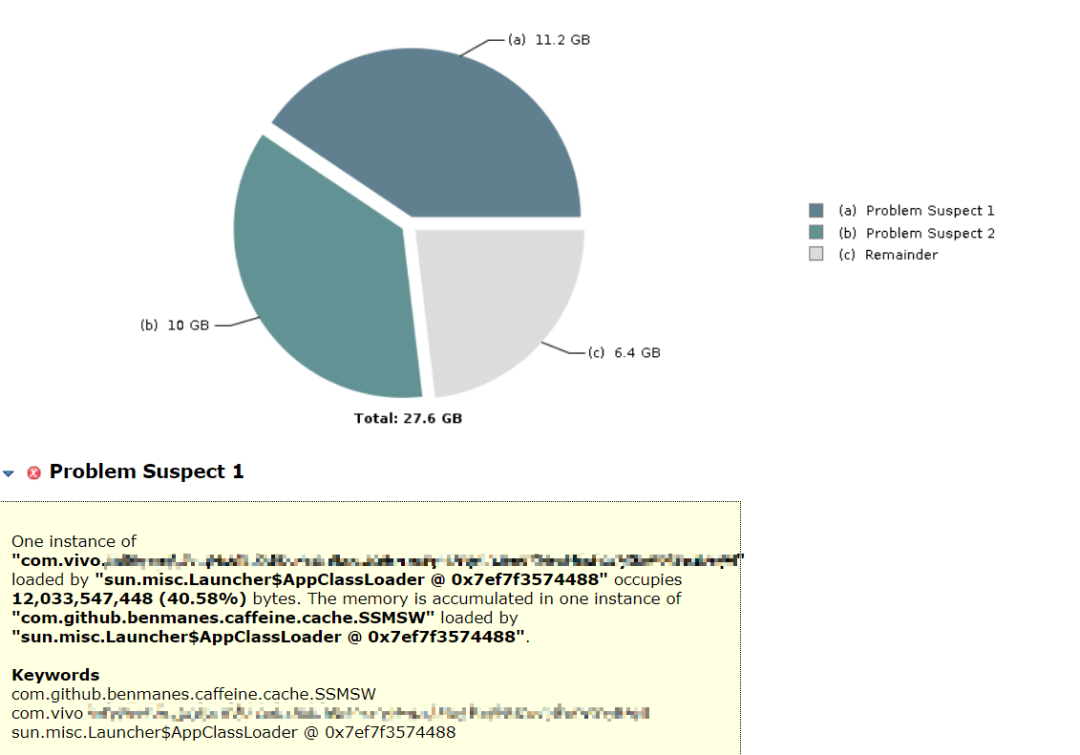
We dumped the live heap objects of the service, and used the mat tool to perform memory analysis. We found that two objects were particularly huge, accounting for 76.8% of the total live heap memory. in:
The first largest object is the local cache, which stores common data at a fine-grained level, with a data volume of tens of millions per machine; using the caffine cache component, the automatic cache refresh cycle is set to 1 hour; the purpose is to minimize the number of IO queries;
The second largest object is the model weight map itself, which resides in memory and will not be updated. After the new model is loaded, it will be unloaded as the old model.
4.1.2 Optimization scheme
How to cache as much data as possible while avoiding excessive GC pressure?
We thought of moving the cache object to the outside of the heap, so that it is not limited by the size of the in-heap memory; and the out-of-heap memory is not controlled by the JVM GC, which avoids the impact of too large cache on the GC. After research, we decided to use the mature open source off-heap cache component OHC.
(1) Introduction to OHC
Introduction
The full name of OHC is off-heap-cache, that is, off-heap cache. It is a caching framework developed for Apache Cassandra in 2015. It was later separated from the Cassandra project and became a separate class library. Its project address is
https://github.com/snazy/ohc.
characteristic
Data is stored outside the heap, and only a small amount of metadata is stored in the heap, which does not affect GC
Support to set expiration time for each cache item
Support configuring LRU, W_TinyLFU eviction policy
Ability to maintain a large number of cache entries
Support for asynchronous loading of caches
Read and write speed in microseconds
(2) OHC usage
Quick start:
OHCache ohCache = OHCacheBuilder.newBuilder().keySerializer(yourKeySerializer).valueSerializer(yourValueSerializer).build();
Optional configuration items:
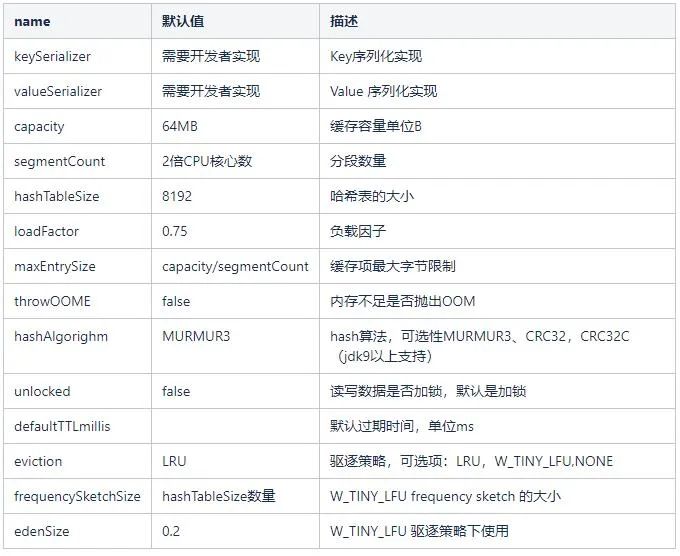
In our service, the capacity is set to 12G, the segmentCount is 1024, and the serialization protocol uses kryo.
4.1.3 Optimization effect
After switching to off-heap cache, service YGC is reduced to 800ms/min, overall end-to-end throughputup about 20%.
4.2 Thinking questions
In the Java GC optimization, we moved the local cache objects from the Java heap to the heap, and achieved good performance gains. Remember the other giant object mentioned above, the model weight map? Can the model weight map also be removed from the Java heap?
The answer is yes.We used C++ to rewrite the model inference calculation part, including the storage and retrieval of weight map, sorting score calculation and other logic; then the C++ code was output as a so library file, and the Java program passed the native The method is called, and the weight map is moved out of the JVM heap, and good performance gains are obtained.

V. Conclusion
Through the three measures introduced above, we have improved the service load and performance from the aspects of hot code optimization and JVM GC, and the overall throughput has doubled, reaching the staged target.
However, performance tuning is endless, and the actual situation of each business scenario and each system is also very different. It is difficult to cover all the optimization scenarios in one article. I hope that some of the tuning practical experience introduced in this article, such as how to determine the optimization direction, how to start the analysis, and how to verify the benefits, can give you some lessons and references.
END
you may also like
#Performance #Tuning #HighPerformance #Java #Computing #Services #vivo #Internet #Technology #News Fast Delivery