Author: Niu Tong (Qi Wei)
The importance of logs for a program is self-evident. Whether it is used as a means of troubleshooting, recording key node information, or early warning, configuring monitoring panels, etc., all play a crucial role. It’s something that every category, and even every application, needs to record and view. In the cloud-native era, log collection is somewhat different from traditional log collection in terms of collection scheme and collection architecture. We have summarized some practical common problems that are often encountered during the log collection process, such as:
- For applications deployed in K8s, the disk size will be much smaller than that of the physical machine, so all logs cannot be stored for a long time, and there is a demand for querying historical data.
- Log data is very critical and cannot be lost, even after the application restarts and the instance is rebuilt
- I hope to make some keyword and other information alarms on the log, as well as monitor the market
- The authority control is very strict. You cannot use or query log systems such as SLS. You need to import them into your own log collection system.
- The exception stack of JAVA, PHP and other applications will generate a newline, and the stack exception will be printed into multiple lines. How to summarize and view it?
So in the actual production environment, how does the user use the log function to collect it? In the face of different business scenarios and different business demands, which collection scheme is better? Serverless App Engine SAE (Serverless App Engine), as a fully managed, O&M-free, and highly flexible general-purpose PaaS platform, provides multiple collection methods such as SLS collection, NAS-mounted collection, and Kafka collection for users to use in different scenarios. use. This article will focus on the characteristics of various log collection methods, the best usage scenarios, and help you design a suitable collection architecture and avoid some common problems.
SAE log collection method
SLS Acquisition Architecture
SLS log collection is the log collection solution recommended by SAE. It provides one-stop data collection, processing, query and analysis, visualization, alarm, consumption and delivery capabilities.
SAE has built-in integrated SLS collection, which can easily collect business logs and container standard output to SLS. The architecture diagram of SAE integrated SLS is shown in the following figure:
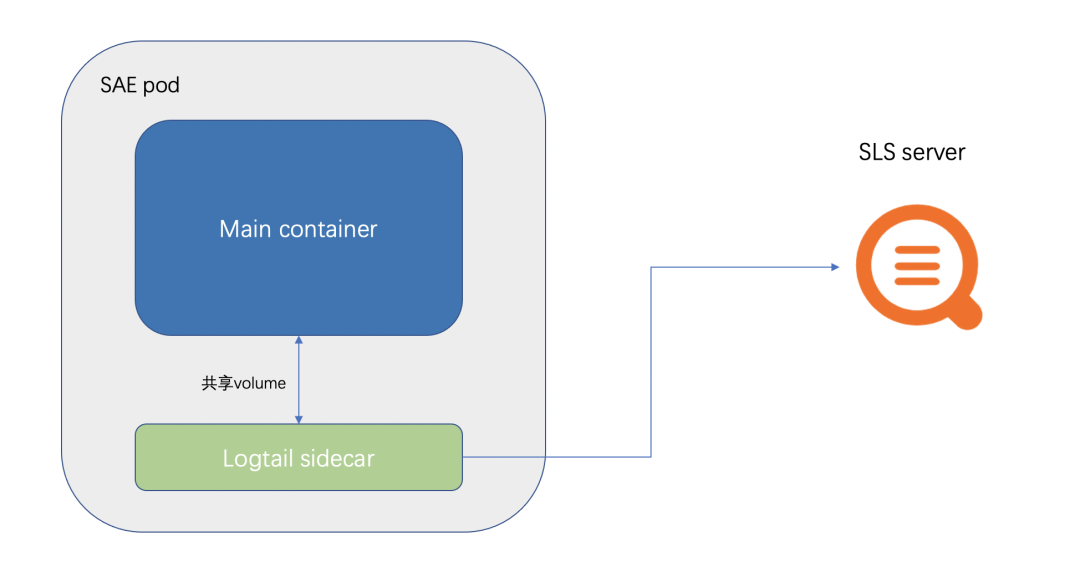
- SAE will mount a sidecar of logtail (the collector of SLS) in the pod.
- Then, the files or paths that need to be collected and configured by the customer are shared with the business Container and the logtail sidecar in the form of volumes. This is also the reason why SAE log collection cannot be configured in /home/admin. Because the startup container of the service is placed in /home/admin, mounting the volume will overwrite the startup container.
- At the same time, logtail data is reported through the SLS intranet address, so there is no need to open the extranet.
- SLS’s sidecar collection, in order not to affect the operation of the business container, will set the resource limit, for example, the CPU is limited to 0.25C, and the memory is limited to 100M.
SLS is suitable for most business scenarios and supports the configuration of alarms and monitoring graphs. Most of them are suitable for choosing SLS directly.
NAS capture architecture
NAS is a distributed file system with shared access, elastic expansion, high reliability and high performance. It provides high throughput and high IOPS while supporting random reading and writing of files and online modification. More suitable for log scenarios. If you want to save more or larger logs locally, you can mount the NAS, and then point the log file storage path to the NAS mount directory. Mounting the NAS to the SAE does not involve too many technical points and architectures, so I will skip over the introduction here.
When the NAS is used for log collection, it can be regarded as a local disk. Even if the instance crashes and rebuilds, etc., the log will not be lost. For very important scenarios where data loss is not allowed, this solution can be considered .
Kafka ingestion architecture
Users themselves can also collect the contents of log files into Kafka, and then realize log collection by consuming Kafka data. Subsequent users can import the logs in Kafka into ElasticSearch based on their own needs, or program to consume Kafka data for processing, etc.
There are many ways to collect logs into Kafka itself, such as the most common logstach, the relatively lightweight collection components filebeat, vector, and so on. The acquisition component used by SAE is vector. The architecture diagram of SAE integrated vector is shown in the following figure:
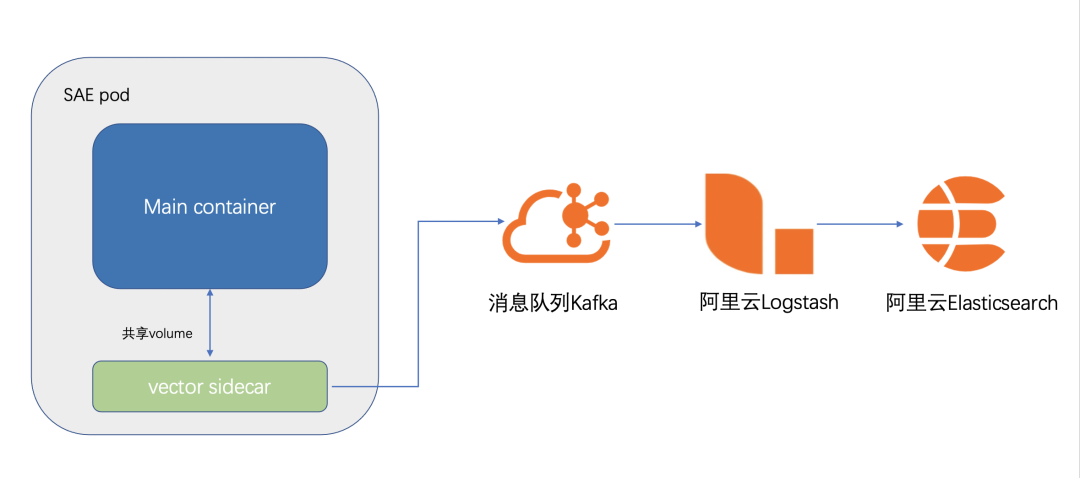
- SAE will mount a sidecar of logtail (vector collector) in the pod.
- Then, the files or paths that need to be collected and configured by the customer are shared with the business Container and the vector sidecar in the form of volumes.
- The vector will periodically send the collected log data to Kafka. The vector itself has a wealth of parameter settings, which can set the compression of the collected data, the interval of data transmission, the collection index and so on.
Kafka collection is a supplement to SLS collection. In the actual production environment, some customers have very strict control over permissions. They may only have SAE permissions but not SLS permissions. Therefore, they need to collect logs into Kafka for subsequent viewing, or have their own requirements for secondary processing of logs, etc. In different scenarios, you can also choose the Kafka log collection scheme.
Here is a basic vector.toml configuration:
data_dir = "/etc/vector"

[sinks.sae_logs_to_kafka]
type = "kafka"
bootstrap_servers = "kafka_endpoint"
encoding.codec = "json"
encoding.except_fields = ["source_type","timestamp"]
inputs = ["add_tags_0"]
topic = "{{ topic }}"

[sources.sae_logs_0]
type = "file"
read_from = "end"
max_line_bytes = 1048576
max_read_bytes = 1048576
multiline.start_pattern = '^[^\s]'
multiline.mode = "continue_through"
multiline.condition_pattern = '(?m)^[\s|\W].*$|(?m)^(Caused|java|org|com|net).+$|(?m)^}.*$'
multiline.timeout_ms = 1000
include = ["/sae-stdlog/kafka-select/0.log"]

[transforms.add_tags_0]
type = "remap"
inputs = ["sae_logs_0"]
source=".topic = "test1""

[sources.internal_metrics]
scrape_interval_secs = 15
type = "internal_metrics_ext"
[sources.internal_metrics.tags]
host_key = "host"
pid_key = "pid"

[transforms.internal_metrics_filter]
type = "filter"
inputs = [ "internal_metrics"]
condition = '.tags.component_type == "file" || .tags.component_type == "kafka" || starts_with!(.name, "vector")'

[sinks.internal_metrics_to_prom]
type = "prometheus_remote_write"
inputs = [ "internal_metrics_filter"]
endpoint = "prometheus_endpoint"
Important parameter parsing:
- multiline.start_pattern is when a line that matches this regular pattern is detected, it will be treated as a new data
- multiline.condition_pattern is when a line that conforms to this regular pattern is detected, it will be merged with the previous line and treated as one line
- After sinks.internal_metrics_to_prom is configured, the collection metadata of some vectors will be reported to prometheus
The following are some collection and monitoring diagrams that configure the metadata collected by vector to Prometheus, and configure the metadata of vector in Grafana’s monitoring panel:

Best Practices
In actual use, you can choose different log collection methods according to your own business requirements. The log collection strategy of logback itself needs to limit the file size and number of files, otherwise it will be easier to fill up the pod’s disk. Taking JAVA as an example, the following configuration will retain a maximum of 7 files, each with a maximum size of 100M.
    <appender name="TEST"
              class="ch.qos.logback.core.rolling.RollingFileAppender">
        <file>${user.home}/logs/test/test.log</file>
        <rollingPolicy class="ch.qos.logback.core.rolling.FixedWindowRollingPolicy">
            <fileNamePattern>${user.home}/logs/test/test.%i.log</fileNamePattern>
            <minIndex>1</minIndex>
            <maxIndex>7</maxIndex>
        </rollingPolicy>

        <triggeringPolicy
                class="ch.qos.logback.core.rolling.SizeBasedTriggeringPolicy">
            <maxFileSize>100MB</maxFileSize>
        </triggeringPolicy>

        <encoder class="ch.qos.logback.classic.encoder.PatternLayoutEncoder">
            <charset>UTF-8</charset>
            <pattern>%d{yyyy-MM-dd HH:mm:ss}|%msg%n</pattern>
        </encoder>

    </appender>
This log4j configuration is a relatively common log rotation configuration.
There are two common log rotation methods, one is create mode and the other is copytruncate mode. Different log collection components have some differences in the level of support for the two.
The create mode is to rename the original log file and create a new log file to replace. This mode is used by log4j. The detailed steps are shown in the following figure:
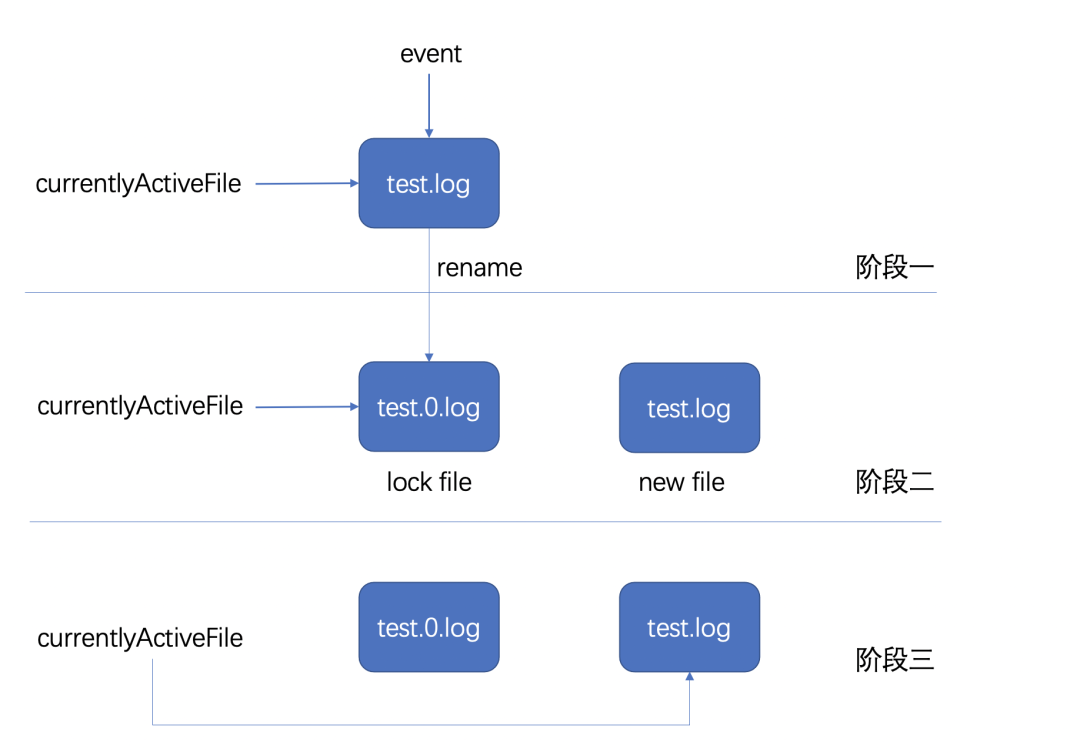
- When the event log of the log is written, it will judge whether the maximum capacity of the file has been reached. If it is not reached, the writing will be completed. If it is reached, it will enter the second stage.
- First close the file pointed to by currentlyActiveFile, then rename the original file and create a new file with the same name as the one pointed to by currentlyActiveFile before
- Change the file pointed to by currentlyActiveFile to the newly created file in stage 2
The idea of copytruncate mode is to copy the output log, and then trucate the original log.
The current mainstream components are supported as follows:

Actual case demonstration
The following introduces some real scenarios in the actual production environment of customers.
A customer A configures the logs of the program through log rotation, and collects the logs to SLS. And configure related alarms through keywords, monitor the market, etc.
First, through the configuration of log4j, keep up to 10 log files, each with a size of 200M, to keep the monitoring of the disk, and save the log files in the path of /home/admin/logs. I won’t go into too much introduction here, but the configuration can be introduced in the best practice scenario.
Then, the logs are collected into SLS through the SLS log collection function of SAE.
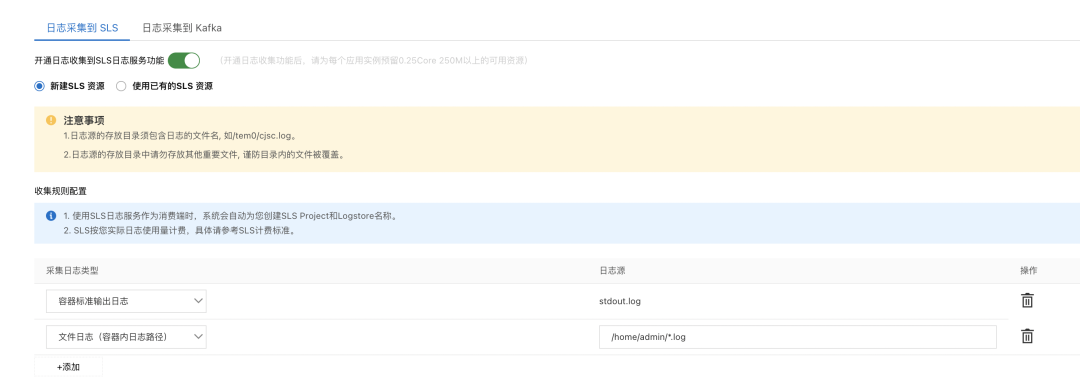
Finally, through some keywords in the log in the program, or some other rules, such as the 200 status code ratio, the alarm configuration is carried out.
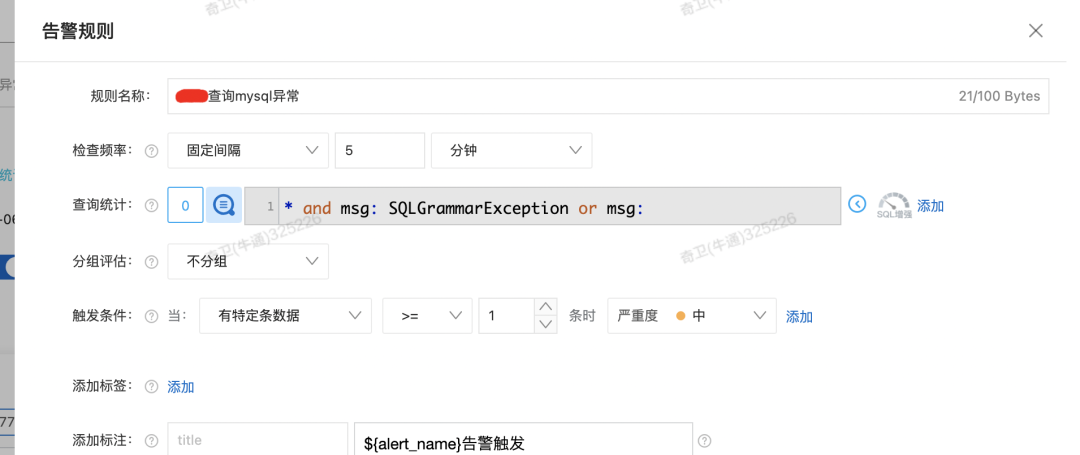
The configuration of monitoring the large disk is completed through the Nginx log.
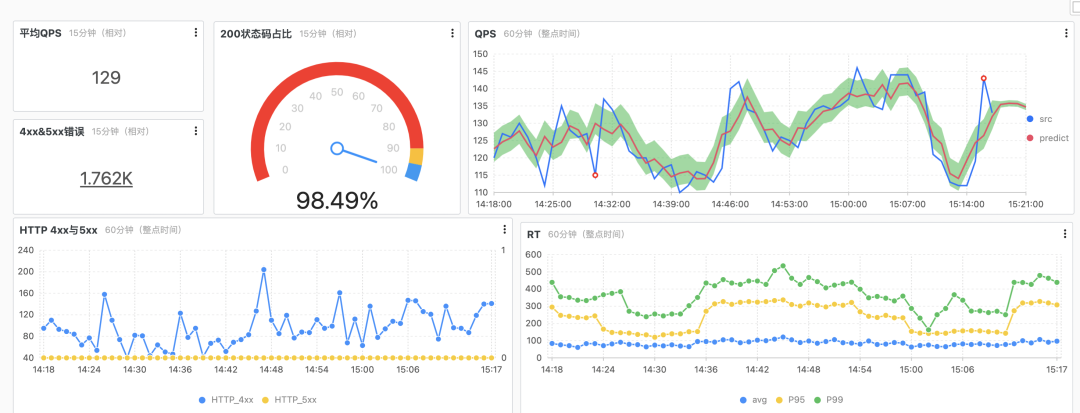
common problem
Introduction to log merging
Many times, we need to collect logs, not simply line by line, but need to combine multiple lines of logs into one line for collection, such as JAVA exception logs. At this time, you need to use the log merge function.
In SLS, there is a multi-line mode acquisition mode, which requires the user to set a regular expression for multi-line merging.
Vector collection also has similar parameters, multiline.start_pattern is used to set the regularity of the new line, and it will be considered as a new line if this regularity is met. Can be used in conjunction with the multiline.mode parameter. For more parameters, please refer to the official website of vector.
Log collection loss analysis
Whether it is SLS collection or vector collection to Kafka, in order to ensure that the collection log is not lost. The collected checkpoint information will be saved locally. If there are abnormal situations such as the unexpected shutdown of the server or the process crash, the data will be collected from the last recorded position to ensure that the data will not be lost as much as possible.
But this does not guarantee that the log will not be lost. In some extreme scenarios, log collection may be lost, for example:
The K8s pod process crashes, and the liveness fails continuously, which causes the pod to rebuild.
The log rotation speed is extremely fast, such as 1 rotation per second.
The log collection speed cannot reach the log generation speed for a long time.
For scenarios 2 and 3, you need to check your own application to see if too many unnecessary logs are printed, or if the log rotation setting is abnormal. Because under normal circumstances, these situations should not occur. For scenario 1, if the log requirements are very strict and cannot be lost after the pod is rebuilt, the mounted NAS can be used as the log storage path, so that the log will not be lost even after the pod is rebuilt.
Summarize
This article focuses on the introduction of various log collection solutions provided by SAE, as well as the related architecture and usage characteristics of scenarios. To sum up three points:
- SLS collection has strong adaptability and is practical for most scenarios
- NAS collection will not be lost in any scenario, suitable for scenarios with very strict log requirements
- Kafka collection is a supplement to SLS collection. In cases where secondary processing of logs is required, or SLS cannot be used due to permissions and other reasons, you can choose to collect logs into Kafka for collection and processing.
Alibaba Cloud has launched SAE Job, which supports full hosting of XXL-JOB and ElasticJob tasks with zero transformation and migration.
Currently in the hot public beta, the commercial charges will be officially launched on September 1, 2022, everyone is welcome to use it!
As a task-oriented Serverless PaaS platform, SAE Job focuses on solving user efficiency and cost issues. According to business data processing requirements, a large number of computing tasks can be quickly created in a short period of time, and computing resources can be quickly released after the tasks are completed. Supports single-machine, broadcast, parallel computing, sharded task model, timing, timeout retry, blocking strategy and other core task features, which are more convenient to use than open source task frameworks (no code intrusion) and more economical (resources are released immediately after the task runs) , more stable (automatic retry on failure), more transparent (visualized monitoring and alarm), and more worry-free (no operation and maintenance).
For more product content, click here to view~
#Understand #SAE #log #collection #architecture #article #Alibaba #Cloud #Cloud #Native #Personal #Space #News Fast Delivery
